 Tony Finch – blog
[ adapted from a Twitter thread ]
Normally I only pay attention to leap seconds every 6 months when the IERS publishes Bulletin C, the leap second yes or no announcement. But this week brings news from Michael Deckers via the LEAPSECS mailing list, and it relates to Bulletin A, which is why it’s off my usual 6 month schedule.
Leap seconds exist because the Earth takes (very roughly) about a millisecond more than 24 * 60 * 60 seconds to rotate each day; when we have accumulated enough extra milliseconds, a leap second is inserted into UTC to keep it in sync with the Earth. At the moment the Earth is rotating faster than in recent decades: these shorter days, with a lower length-of-day, means the milliseconds accumulate more slowly, and we get fewer leap seconds.
The news from Bulletin A is not unexpected: in January I noted that we are currently in a long gap between leap seconds, and in July I observed that the length of day chart is still very low.
Bulletin A is a weekly summary of predictions from the latest Earth Orientation model. It includes the projected difference between Earth rotation angle (UT1) and UTC, which in turn determines when a leap second is needed. The notable thing about the latest Bulletin A is the factor 0.00000 in the equation
UT1-UTC = -0.1746 - 0.00000 (MJD - 59173) - (UT2-UT1)
[ Tangential aside: I feel the need to describe 0.00000 as all balls, because in PostgreSQL you can use “allballs” in a time literal as an alias for midnight :-) ]
The zero factor is multiplied by the date, which is writtem MJD - 59173. This is the time in days after 20th November; the product indicates how much UT1 and UTC are expected to differ in the near future, i.e. the rate of divergence is now zero.
Michael Deckers said in his LEAPSECS message that we haven’t seen a rate difference as low as zero since 1961!
This implies that unless something wild happens, we are very unlikely to have a leap second in the next few years.
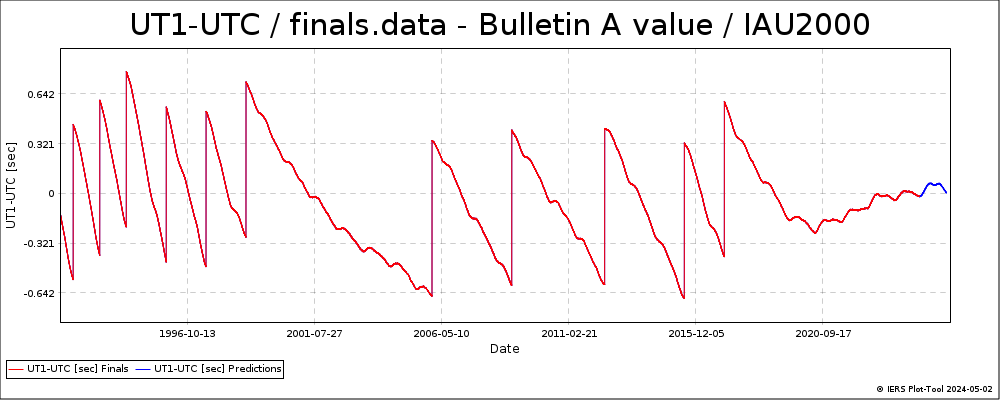
Time for some pictures! (click on the charts to visit interactive versions on the IERS web site)
Here’s a chart of Bulletin A UT1-UTC values, in which you can see the vertical cliffs when leap seconds occurred. See how flat it is towards the end of the chart! Past values are in red, and projected future values in blue.
And here’s the LOD, length of day, the time it takes for the Earth to rotate, measured in milliseconds longer than 24 * 60 * 60 seconds. This is the gradient of the UT1-UTC chart; you can see that it’s a difficult mixture of short-term noise, seasonal variations, and unpredictable longer-term changes.
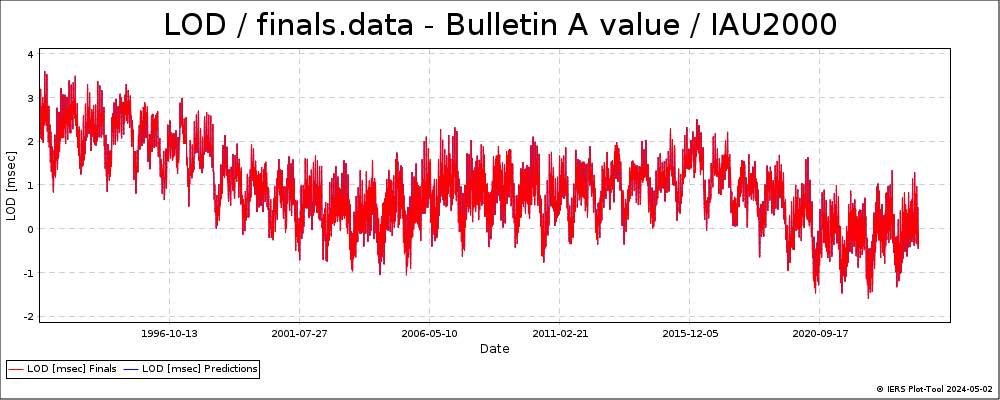
In the charts, compare the recent values to the period 1999 - 2006, which was the longest gap between leap seconds. The numbers suggest the current gap will be even longer.
The absence of leap seconds has the advantage that leap second bugs don’t get tickled, but it has the disadvantage that timekeeping code might rot and new bugs or regressions can be introduced without anyone noticing. Even worse is the risk of the length of day getting shorter which could in theory mean we might need a negative leap second. There has never been a negative leap second, and if there is one, everyone who deals with NTP or kernel timekeeping code expects that it will be an appalling shitshow.
So, I guess, let’s all hope that the Bulletin A UT1-UTC chart remains nice and flat :-)