The first weekend of February is for me by now traditionally the FOSDEM weekend. FOSDEM is arguably the biggest Open Source Developers conference in the world with 742 lectures regarding various topic spread over the ULB university campus. The entrance is free and all presentations are recorded and can be streamed live during the conference (useful when you were not able to enter a full room), or later at your leisure from video.fosdem.org.
This year marks the 10th time that Cisco sponsors the network infrastructure. As this is a ‘least effort, maximum results’ exercise we try to not change the architecture between the years, so there should be no nasty surprises. So again, just like the last few years, we had an IPv6-only with DNS64/NAT64 ‘main’ network and a dual stack ‘legacy’ network, both routed towards the internet via an ASR1006 which provided DHCP, SLAC and NAT64 services.
Every year we try to analyze the network and traffic to provide a glimpse of what ‘state of the art’ traffic looks like. The population of users at FOSDEM is far from a typical business environment, but this data does provide an idea of future trends.
Network-wise, the main takeaways this year are:
- There were more clients on the IPv6 native network then on the IPv4 network, with on Sunday afternoon ~3330 IPv4 DHCP clients against ~4300 reachable IPv6-only clients and ~1300 IPv6 clients on the dual stack network. The grafana statistics show a similar picture:

- This shows that native IPv6 plus DNS64/NAT64 is a valid alternative for the vast majority of users.
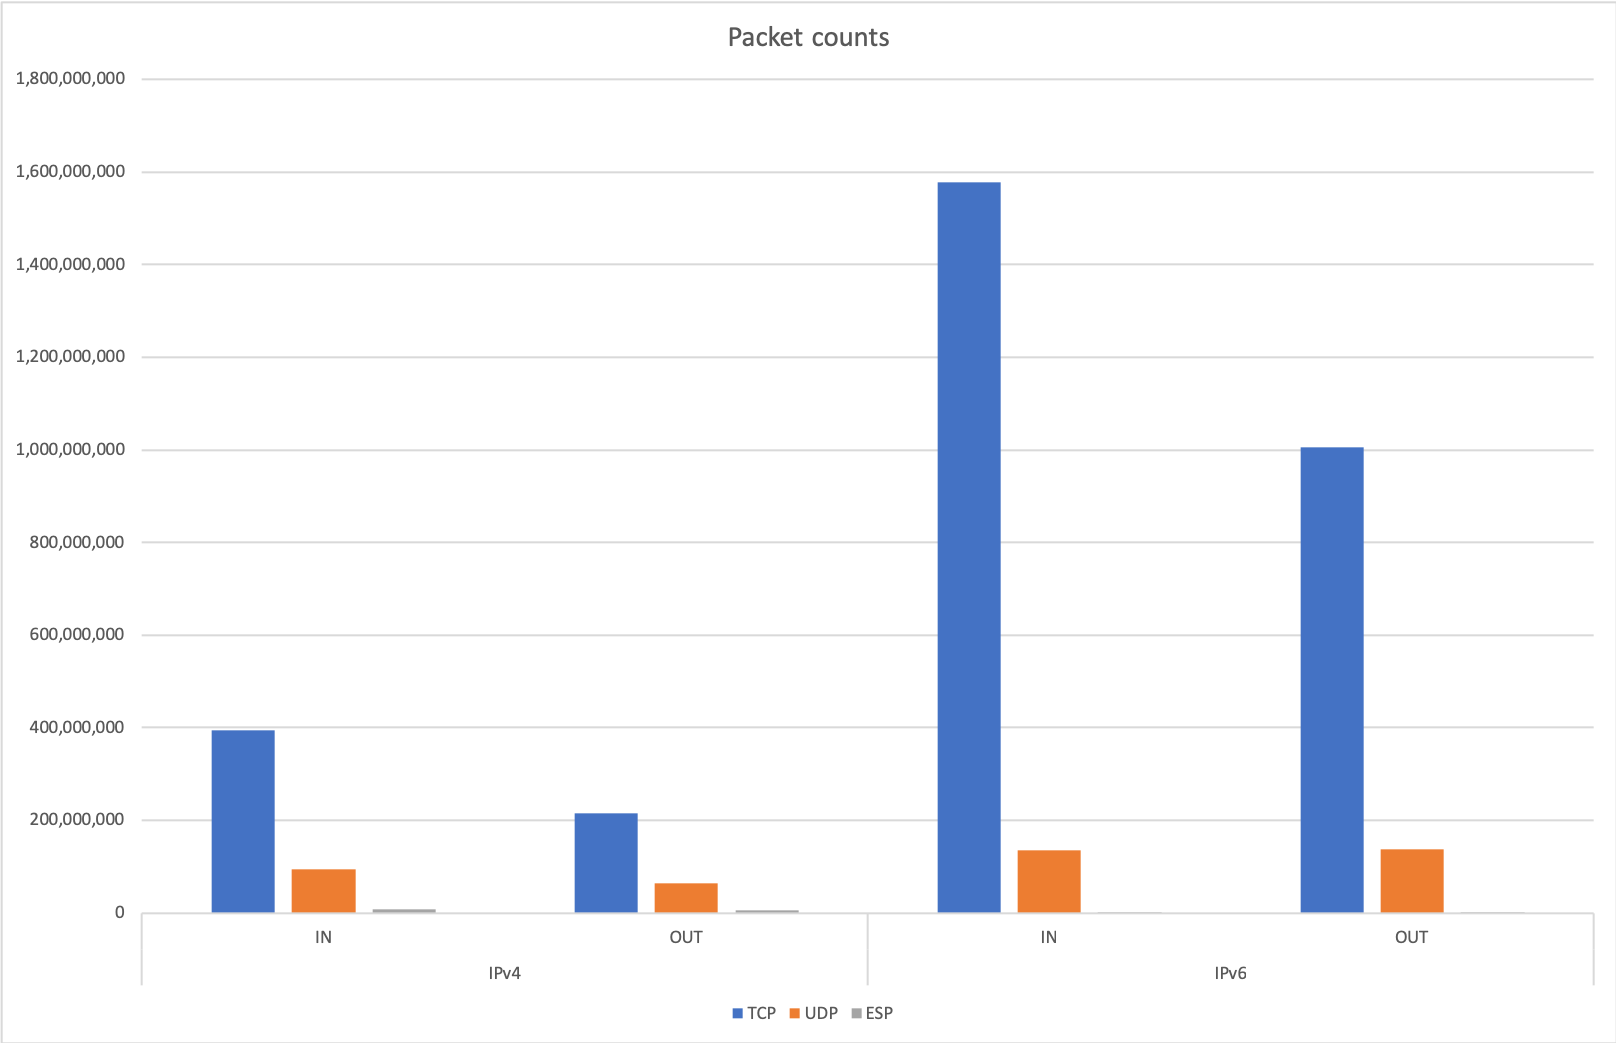
- When we look into the legacy dual stack network, we notice that for the IPv4 traffic distribution we see outgoing ~214M TCP packets and ~6M ESP (VPN) packets while incoming was ~394M TCP packets with ~8M ESP packets. This means that at least about 2-3% of all traffic was on an IPSEC VPN. And this excludes the TCP VPN traffic on ports 443/TCP and 22/TCP. On the IPv6 network we do not see a similar amount of ESP traffic.
- This strongly suggests that the people remaining on the dual stack network do so because their VPN solution does not work with an IPv6 only network.
- Traffic wise we broke all records with 2,960,975,295,300 bytes input (up 16.7% compared to last year’s 2,537,252,681,481 bytes) and 1,755,298,210,796 bytes output towards the internet (an increase of 57% compared to last year’s 1,116,884,145,475 bytes).
- Most traffic was IPv6, by far:

As we did in the previous years, we used NBAR to classify the data, so we can give the 10 top data consuming protocols:
asr1k#show ip nbar protocol-discovery interface gi2/2/1 stats byte-count top-n 10
...
                             Input                    Output
                             -----                    ------
Protocol                     Byte Count               Byte Count
---------------------------- ------------------------ ------------------------
ssl                          1024765056806            251043670421
rtmp                         17859365809              839473061541
google-services              175407914561             161785828996
binary-over-http             241852948792             4245784798
statistical-download         29057423539              153776145315
apple-services               128893914984             11742821363
youtube                      102626951521             5252216684
facebook                     93538045035              12754299118
amazon-web-services          89391297834              15666057435
unknown                      81551056347              19952504555
Total                        2958863503183            1756617044390
Or the top bandwidth protocols:
asr1k#show ip nbar protocol-discovery interface gi2/2/1 stats max-bit-rate top-n 10
...
                             Input                    Output
                             -----                    ------
Protocol                     30sec Max Bit Rate (bps) 30sec Max Bit Rate (bps)
---------------------------- ------------------------ ------------------------
ssl                          305058000                71069000
binary-over-http             282241000                18044000
statistical-download         66230000                 218672000
ssh                          70355000                 210668000
google-services              93300000                 81333000
amazon-web-services          119330000                48004000
dropbox                      89163000                 63882000
apple-services               124853000                28109000
icloud                       109747000                41144000
youtube                      74360000                 58941000
Total                        4359491000               1769693000
Again, we see that even open source developers use Google, Amazon, Apple, Facebook and watch YouTube. The large amount of ssh traffic would stand out in a more corporate environment however.
Last year we also noticed that identifying the clients from the HTTP traffic became a lot more difficult as we started seeing randomized MAC addresses: Saturday stats, total stats, statistics for ‘real’ MAC addresses. This makes it almost impossible to guess the operating system used by the clients.
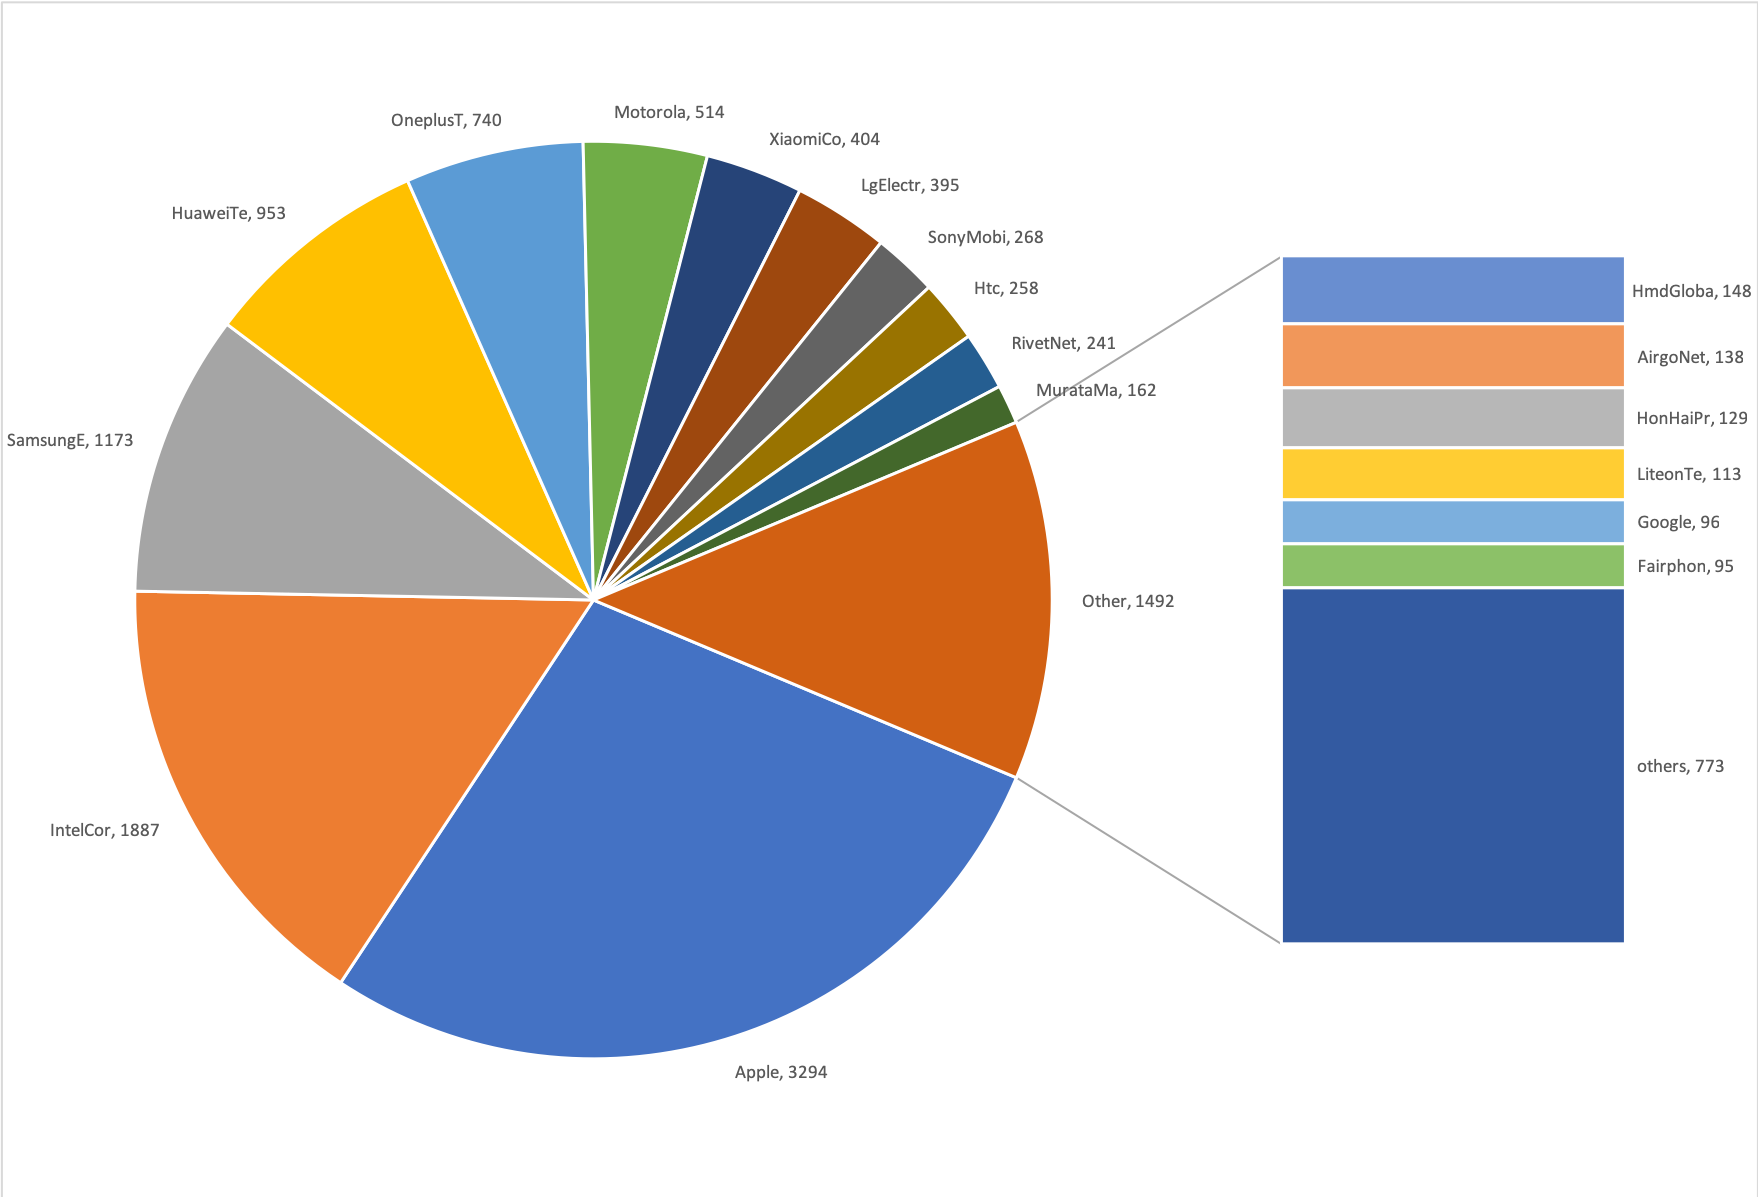
This year these trends continued. We had 129,959 unique MAC addresses during the conference, this excludes the random MAC addresses uses to probe for wireless networks, only MAC addresses which send data across or toward the ASR1006 router are counted. Of these we can assign 11,781 to a known manufacturer. Last year we saw 128,463 unique MAC addresses with only 10,689 MAC addresses were attributable to a manufacturer. From this we can guess that the number of visitors went up by about 10%. The cause for all these random MAC addresses remains unclear.
The distribution of manufacturers shows that Apple is still king of the MACs:
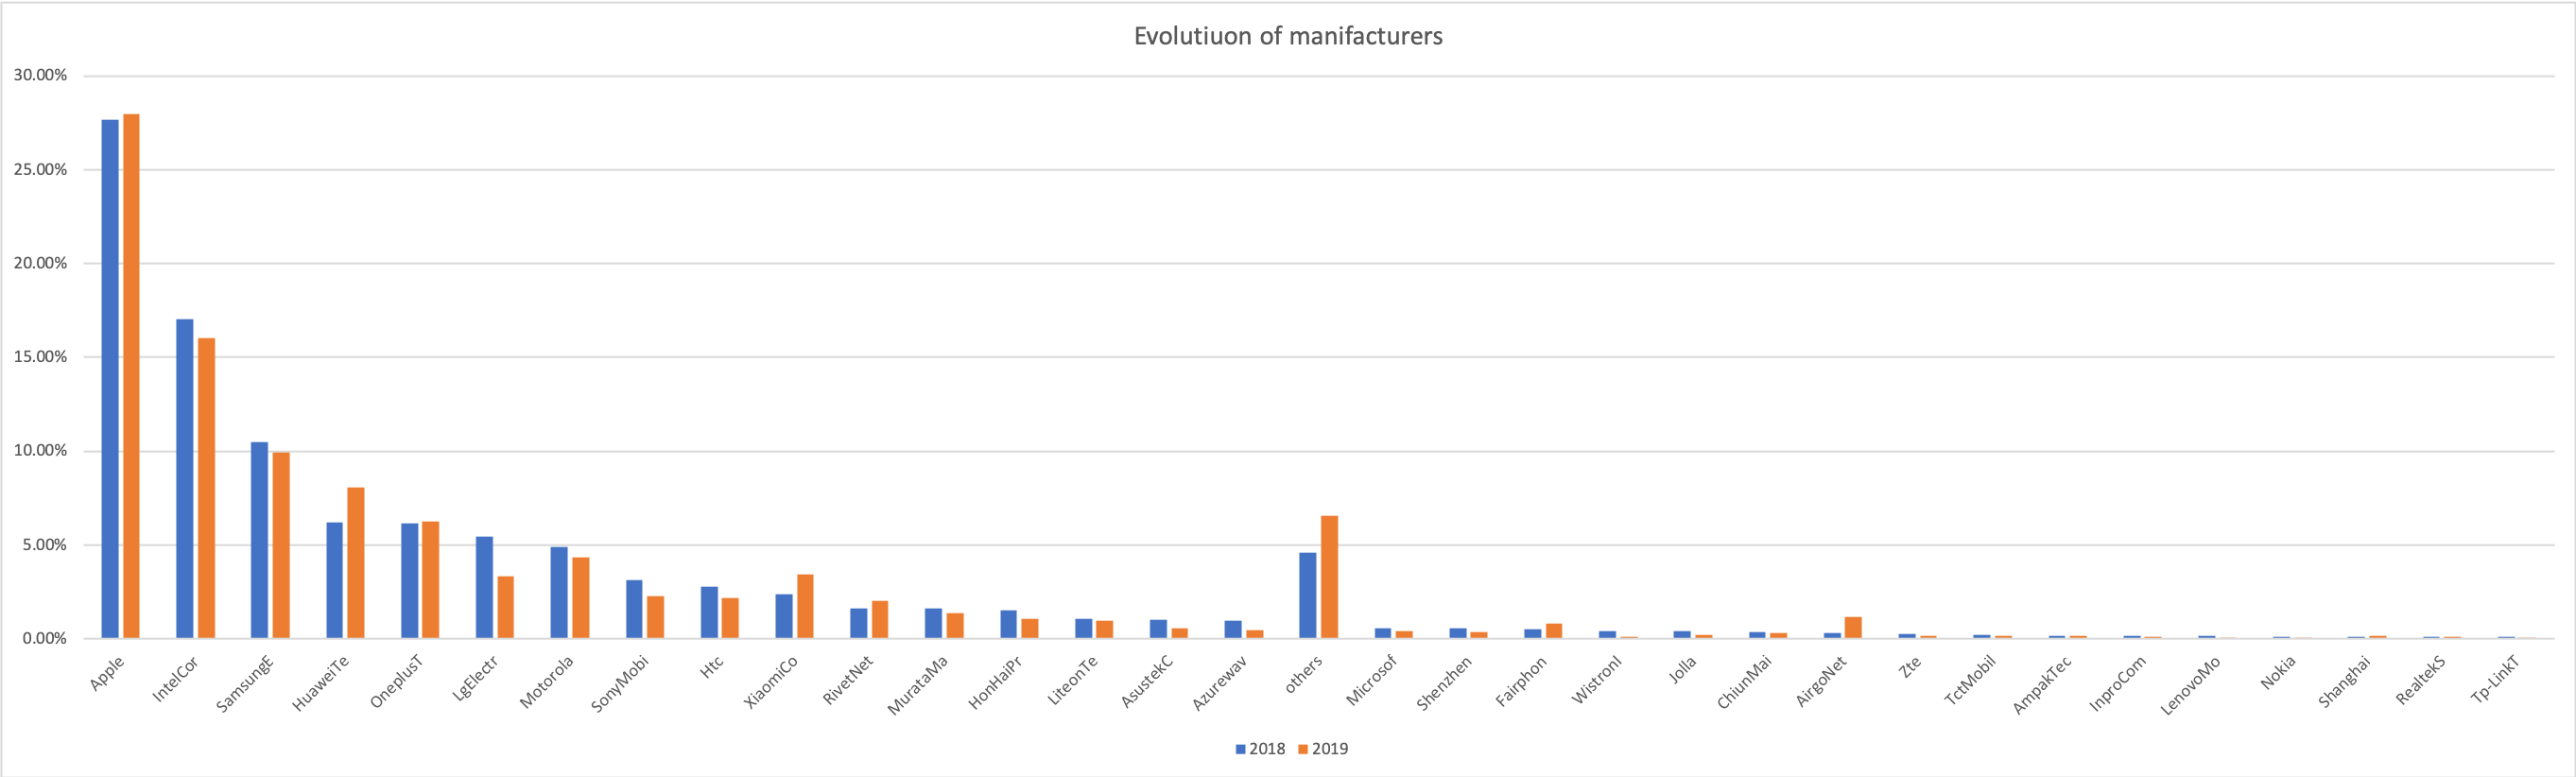
We can the evolution of devices when comparing 2018/2019:
Looking forward we hope to upgrade the backbone of the network from 1Gbps links to 10Gbps links, as we are reaching ~70% of capacity when talking to the WLC which is hosted on the ULB network:
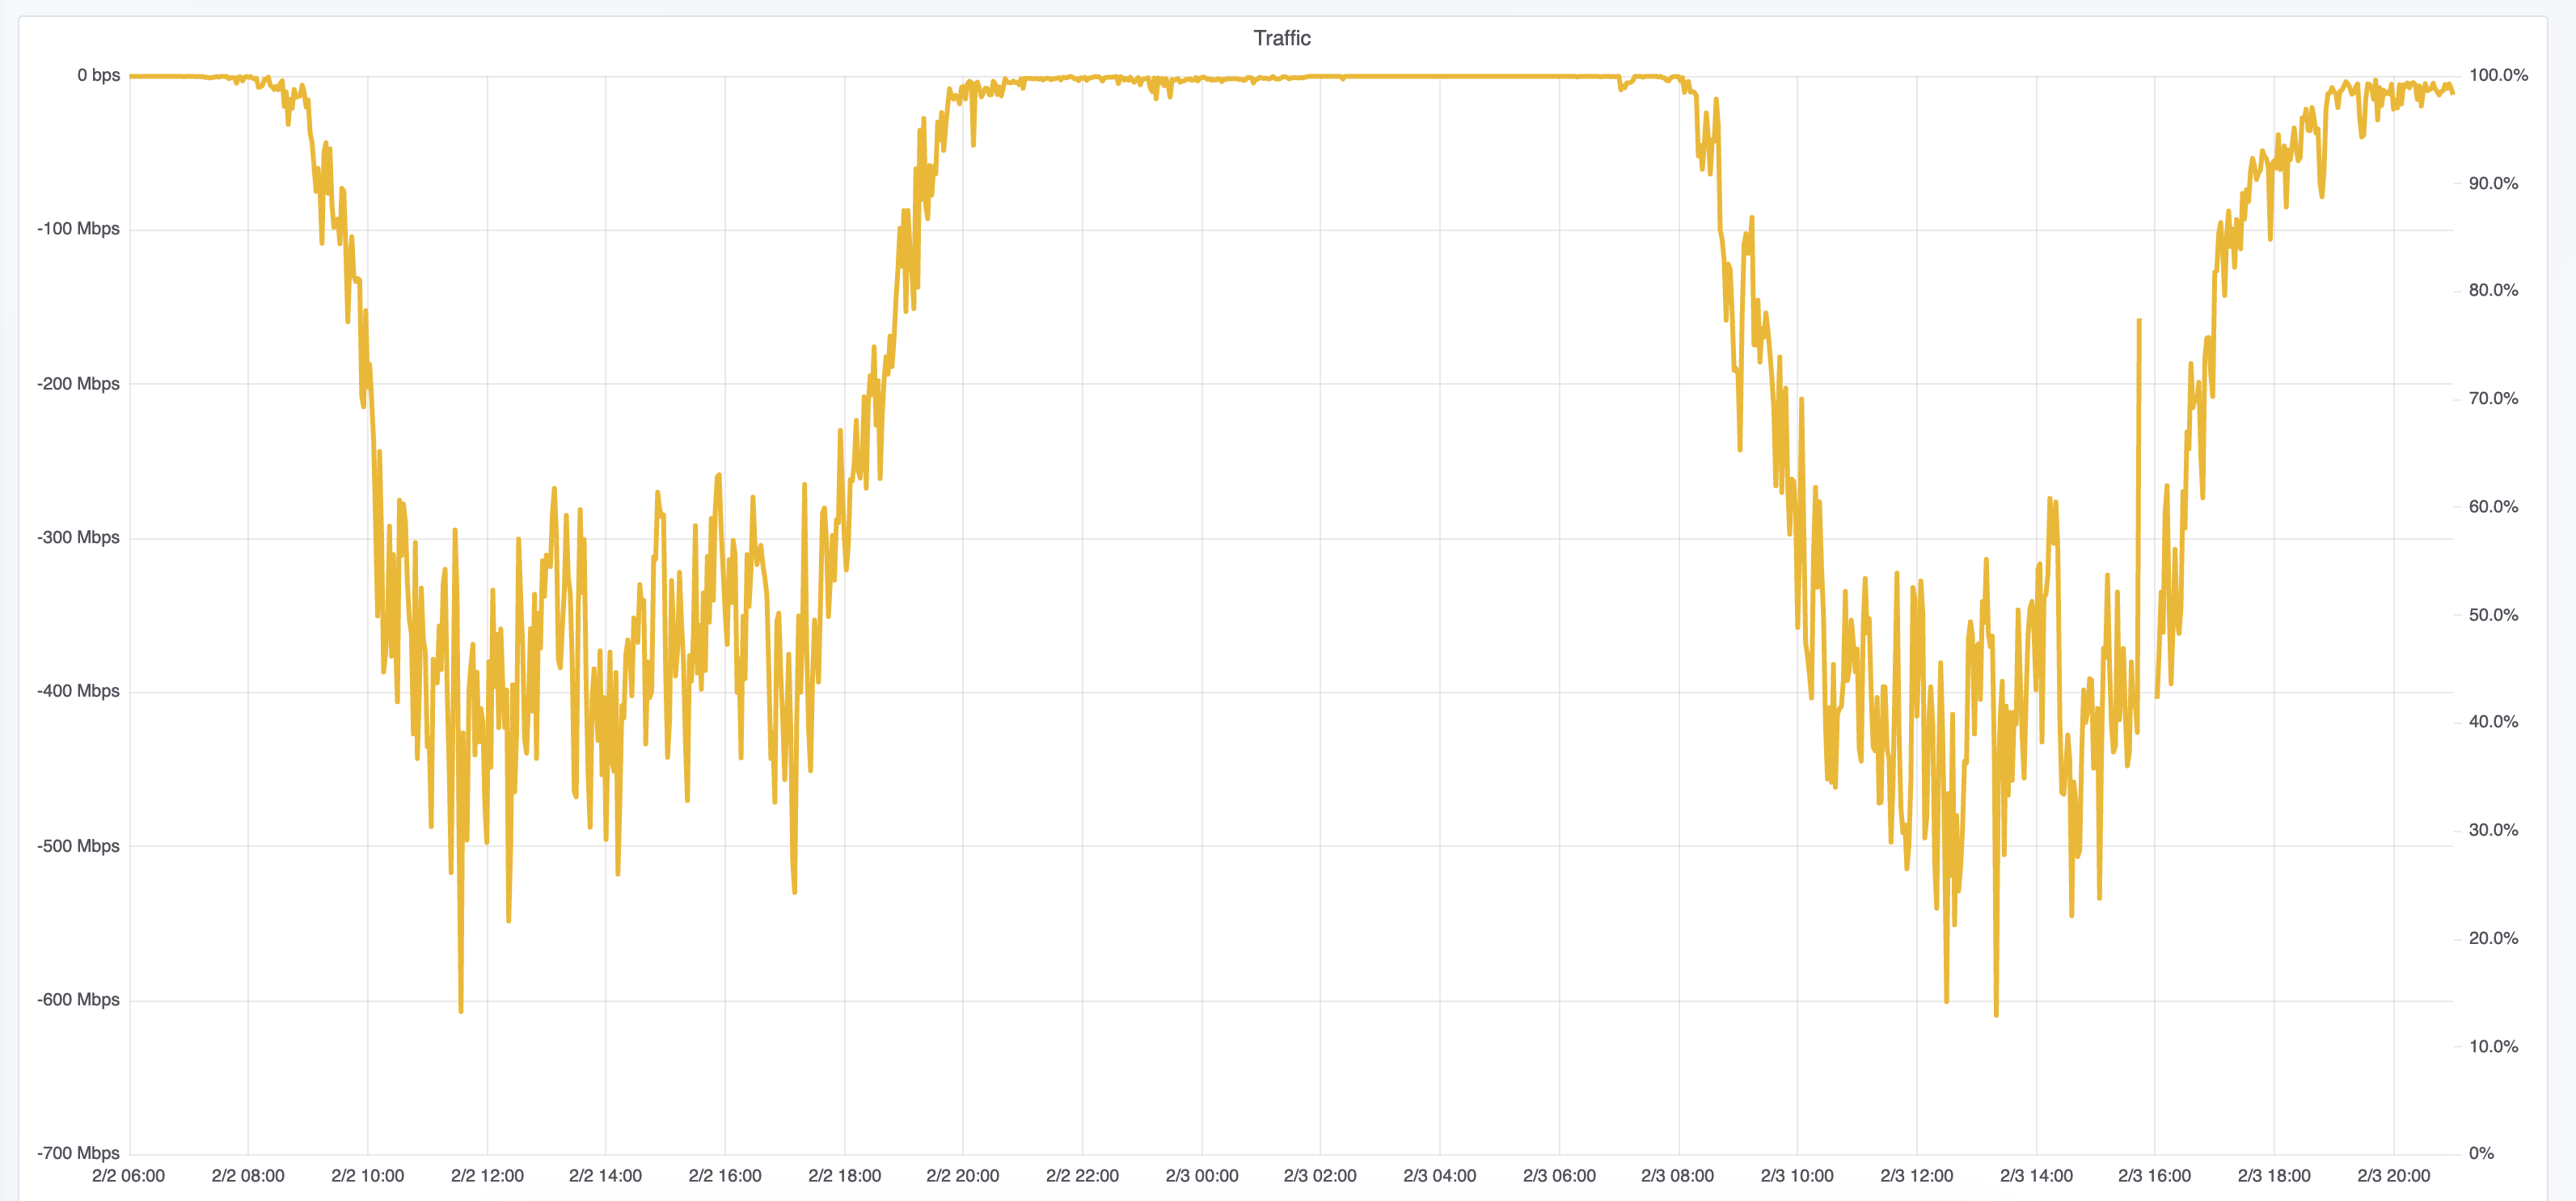
Adding another provider for the internet uplink would be a good thing, currently mostly for redundancy, but the video team’s appetite for bandwidth is large and growing, notice the jump in the internet bandwidth on Sunday afternoon to over 300Mbps, so more bandwidth might be needed in the future.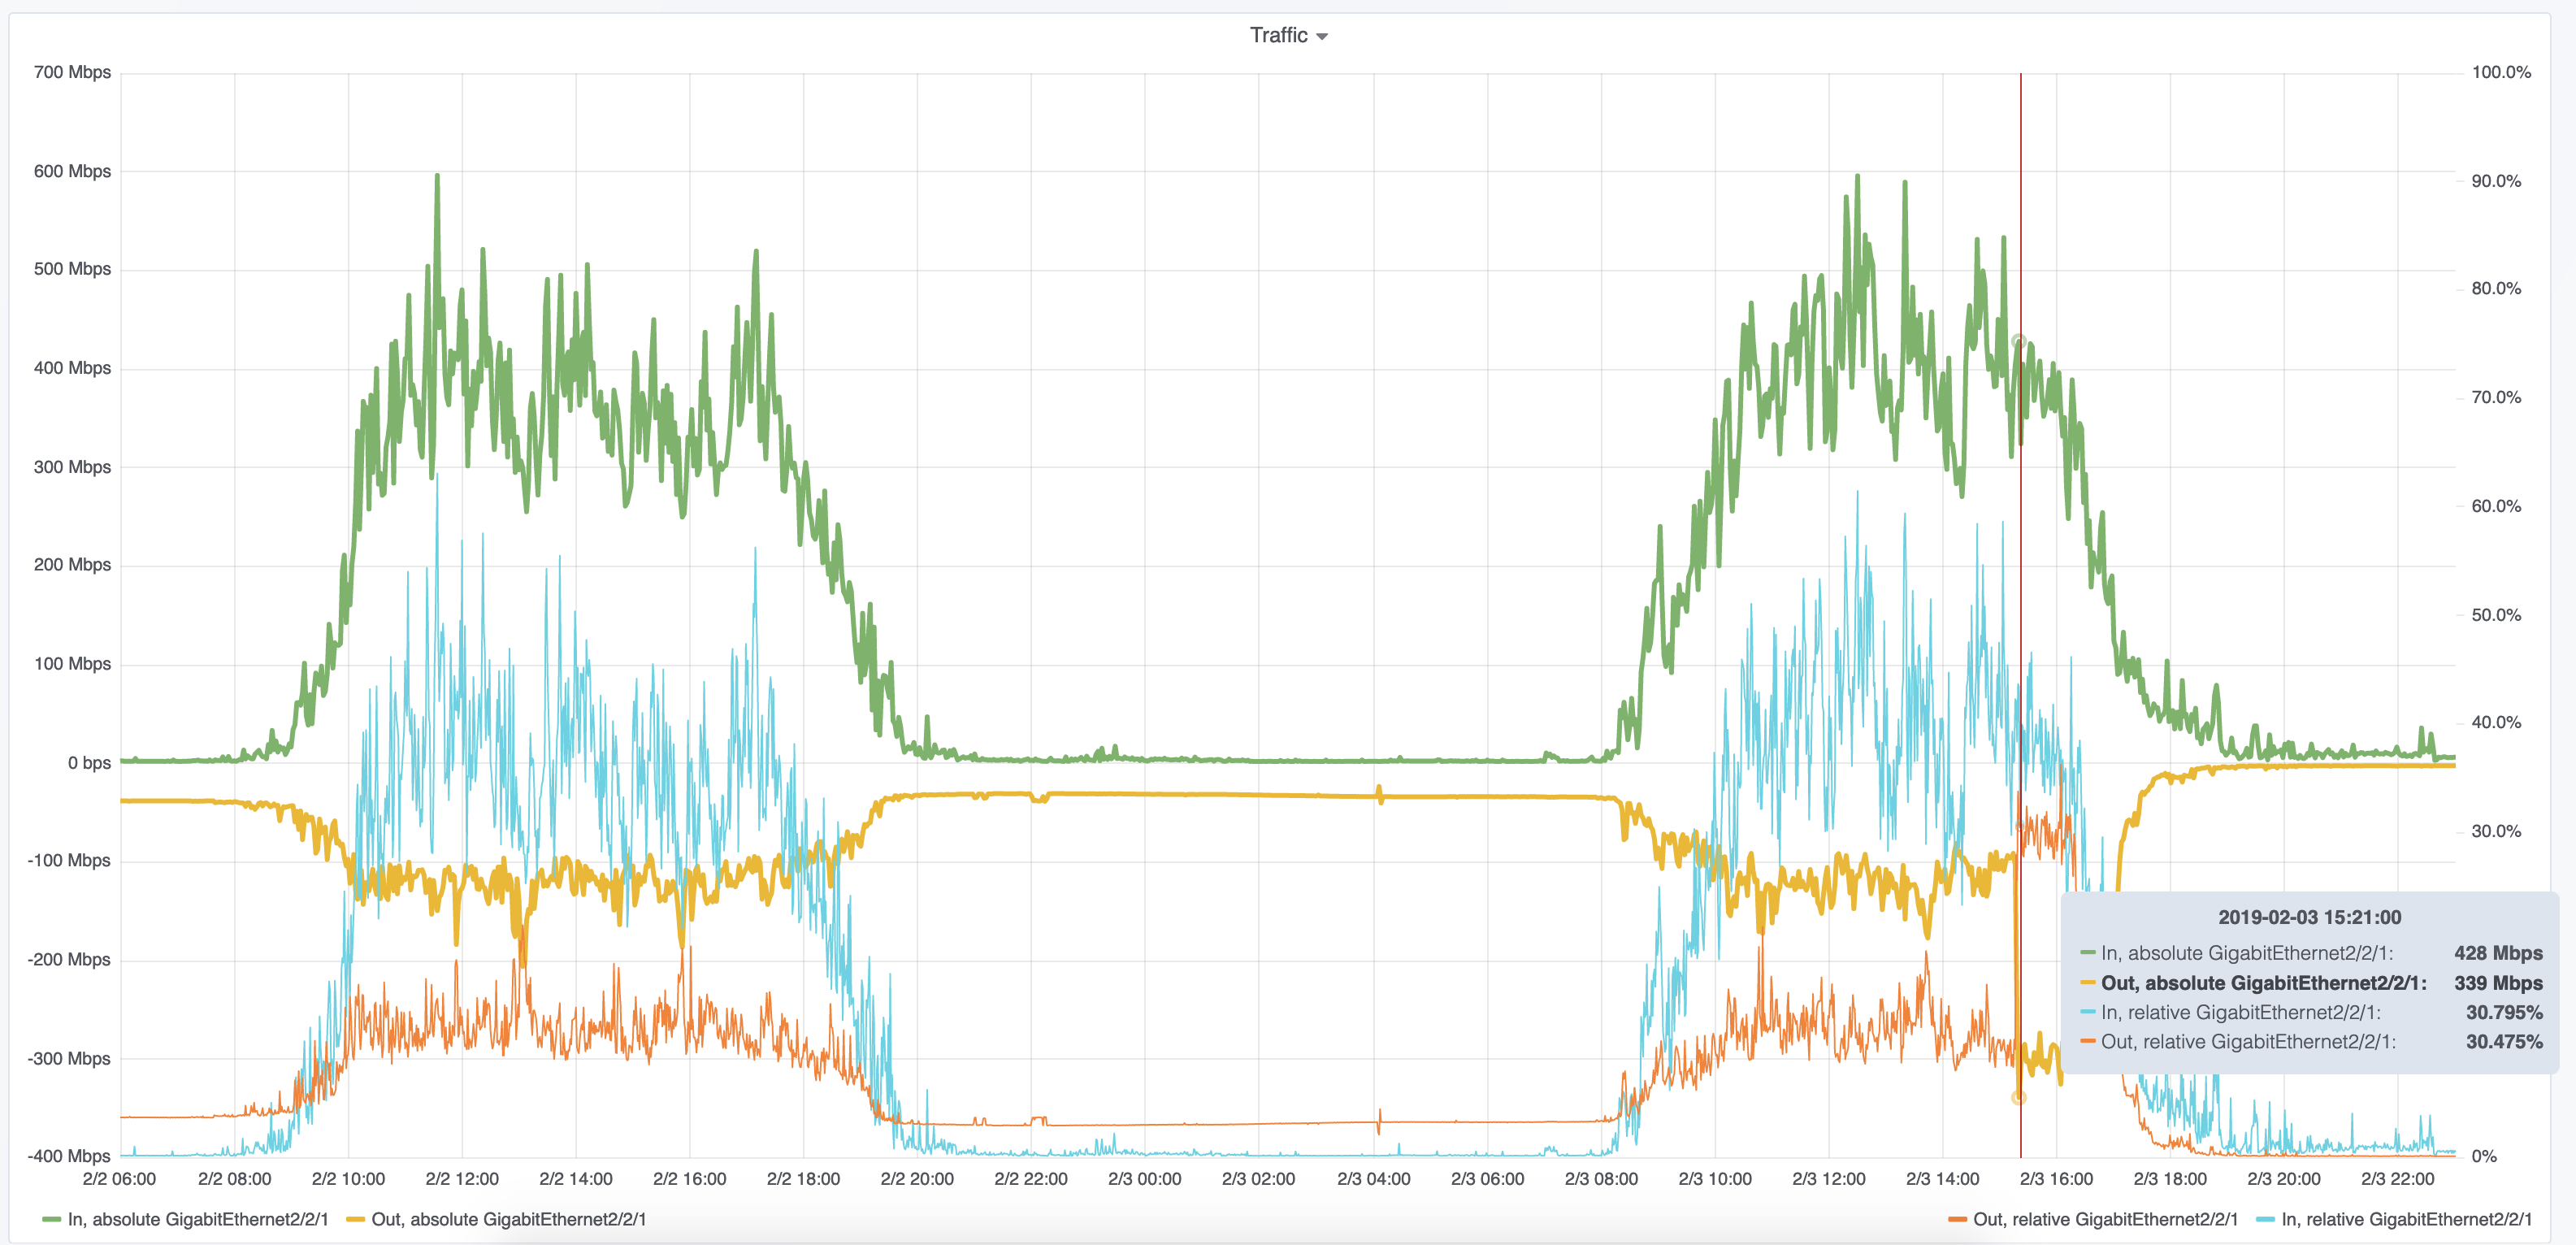
See you all next year!
We’d love to hear what you think. Ask a question or leave a comment below.
And stay connected with Cisco DevNet on social!
Twitter @CiscoDevNet | Facebook | LinkedIn
Visit the new Developer Video Channel


One statistic I didn't see in this was how much IPv6 traffic was translated to IPv4 or vice versa. On the IPv6-only SSID, was the service IPv6 end to end, or did it simply "work OK" with a CNAT? What I would prefer to see is the service the party is going to actually use IPv6 and translation therefore not be used very much – which is what I hear from T-Mobile about its 464XLAT implementation. From the dual stack network's behavior, I would conclude that there is probably a fair bit of translation.
Hi,
On the IPv6-only SSID there was IPv6 traffic end to end if possible. There was no NAT for the IPv6 or IPv4 ranges. Both IPv6-only and dual-stack networks used public IPv6 and IPv4 address ranges.
If an IPv6-only client wanted to communicate with an IPv4 only server then the DNS server, using DNS64, would synthesise an IPv6 address with the 'well known' IPv6 prefix. When that IPv6 client would then send traffic towards this synthetic address the ASR1006 would NAT this traffic using NAT64 into an IPv4 (from the pool on the router) to IPv4 (extracted from the synthesised address).
During FOSDEM we translated 6,711,290 connections composed out of 374,671,589 IPv6 -> IPv4 packets and 587,005,529 IPv4 -> IPv6 reply packets using NAT64. For reference there were 1,255,170,975 outgoing IPv6 packets in total. So about 30% of IPv6 traffic was towards IPv4-only servers and needed to get translated using NAT64.
There was no setup to allow IPv4 devices to talk to IPv6 clients. All our servers are dual-stacked.