

Qrator Labs recently released its 2018 National Internet Segments’ Reliability Survey report.
In this post, I wanted to share with you some of the highlights from the survey, including several new methods we incorporated from the previous survey in 2017.
It only takes one outage to compromise global connectivity
Internet connectivity at the inter-domain level is based on connectivity between Autonomous Systems (ASes). As the number of alternate routes between ASes increases, so does fault-resistance and the stability of the Internet in a given economy increase. However, some paths prove to be more important than others.
The global connectivity of any AS, regardless of whether it is a minor provider or an international giant, depends on the number of its paths to Tier-1 ISPs. Usually, Tier-1 implies an international company offering IP transit at a global scale and its network should be interconnected with other Tier-1 providers.
However, there is no obligation to support these interconnections! Only the market can motivate them to peer with each other and maintain global Internet connectivity. Is that motivation enough? (We explore this question in the IPv6 section below.) Anyway, if an AS loses its connection to at least one of the Tier-1 ISPs, it would likely become unreachable in some parts of the world.
Measuring Internet reliability
Imagine that an AS is experiencing significant network degradation. We want to answer the following question: ‘What percentage of the ASes in this region would lose their global availability due to a single failure?’
Why model such a situation? Strictly speaking, when the BGP and the world of inter-domain routing were in the design stage, the creators assumed that every non-transit AS would have at least two upstream providers to guarantee fault tolerance in case one goes down. However, the reality is different: more than 45% of ISPs have only one connection to an upstream provider. And some weird topologies between transit ISPs further reduces reliability.
So, did transit ISPs ever fail? The answer is yes, and this happens rather often. The proper question is, when would a particular ISP experience service degradation? If such problems seem remote, it may be worth considering Murphy’s Law: ‘Anything that can go wrong, does.’
To observe such a scenario, we have applied the same model for the third year in a row, but we did not merely repeat previous calculations; this year we’ve expanded the research significantly. The following steps were taken to calculate AS reliability:
- For every AS in the world, we retrieved all alternate paths to Tier-1 operators with the help of an AS relation model, core of the Qrator.Radar.
- Using the IPIP geodatabase, we matched economies to the originated address space of every AS.
- For every AS, we counted the share of its address space that corresponds to the selected region. It helped to filter out situations where an ISP may be present at an Internet Exchange Point (IXP) in the given economy but not have any significant presence in the region. A good example is Hong Kong, where hundreds of members of the biggest Asian Internet Exchange, HKIX, exchange traffic but have zero presence in the Hong Kong Internet segment itself.
- We evaluated the effect of a possible failure of a given AS on the other ASes, and thus on the specific economies.
- For each economy, we found the specific AS that affects the largest portion of other ASes in the given region.
IPv4 reliability
Here you can find top 20 economies in terms of reliability in the event of a single failure. In practice, this means that these economies have the most diverse IP-transit market. The percentage shows the portion of ASes that would lose global connectivity in case of a specific AS failure.
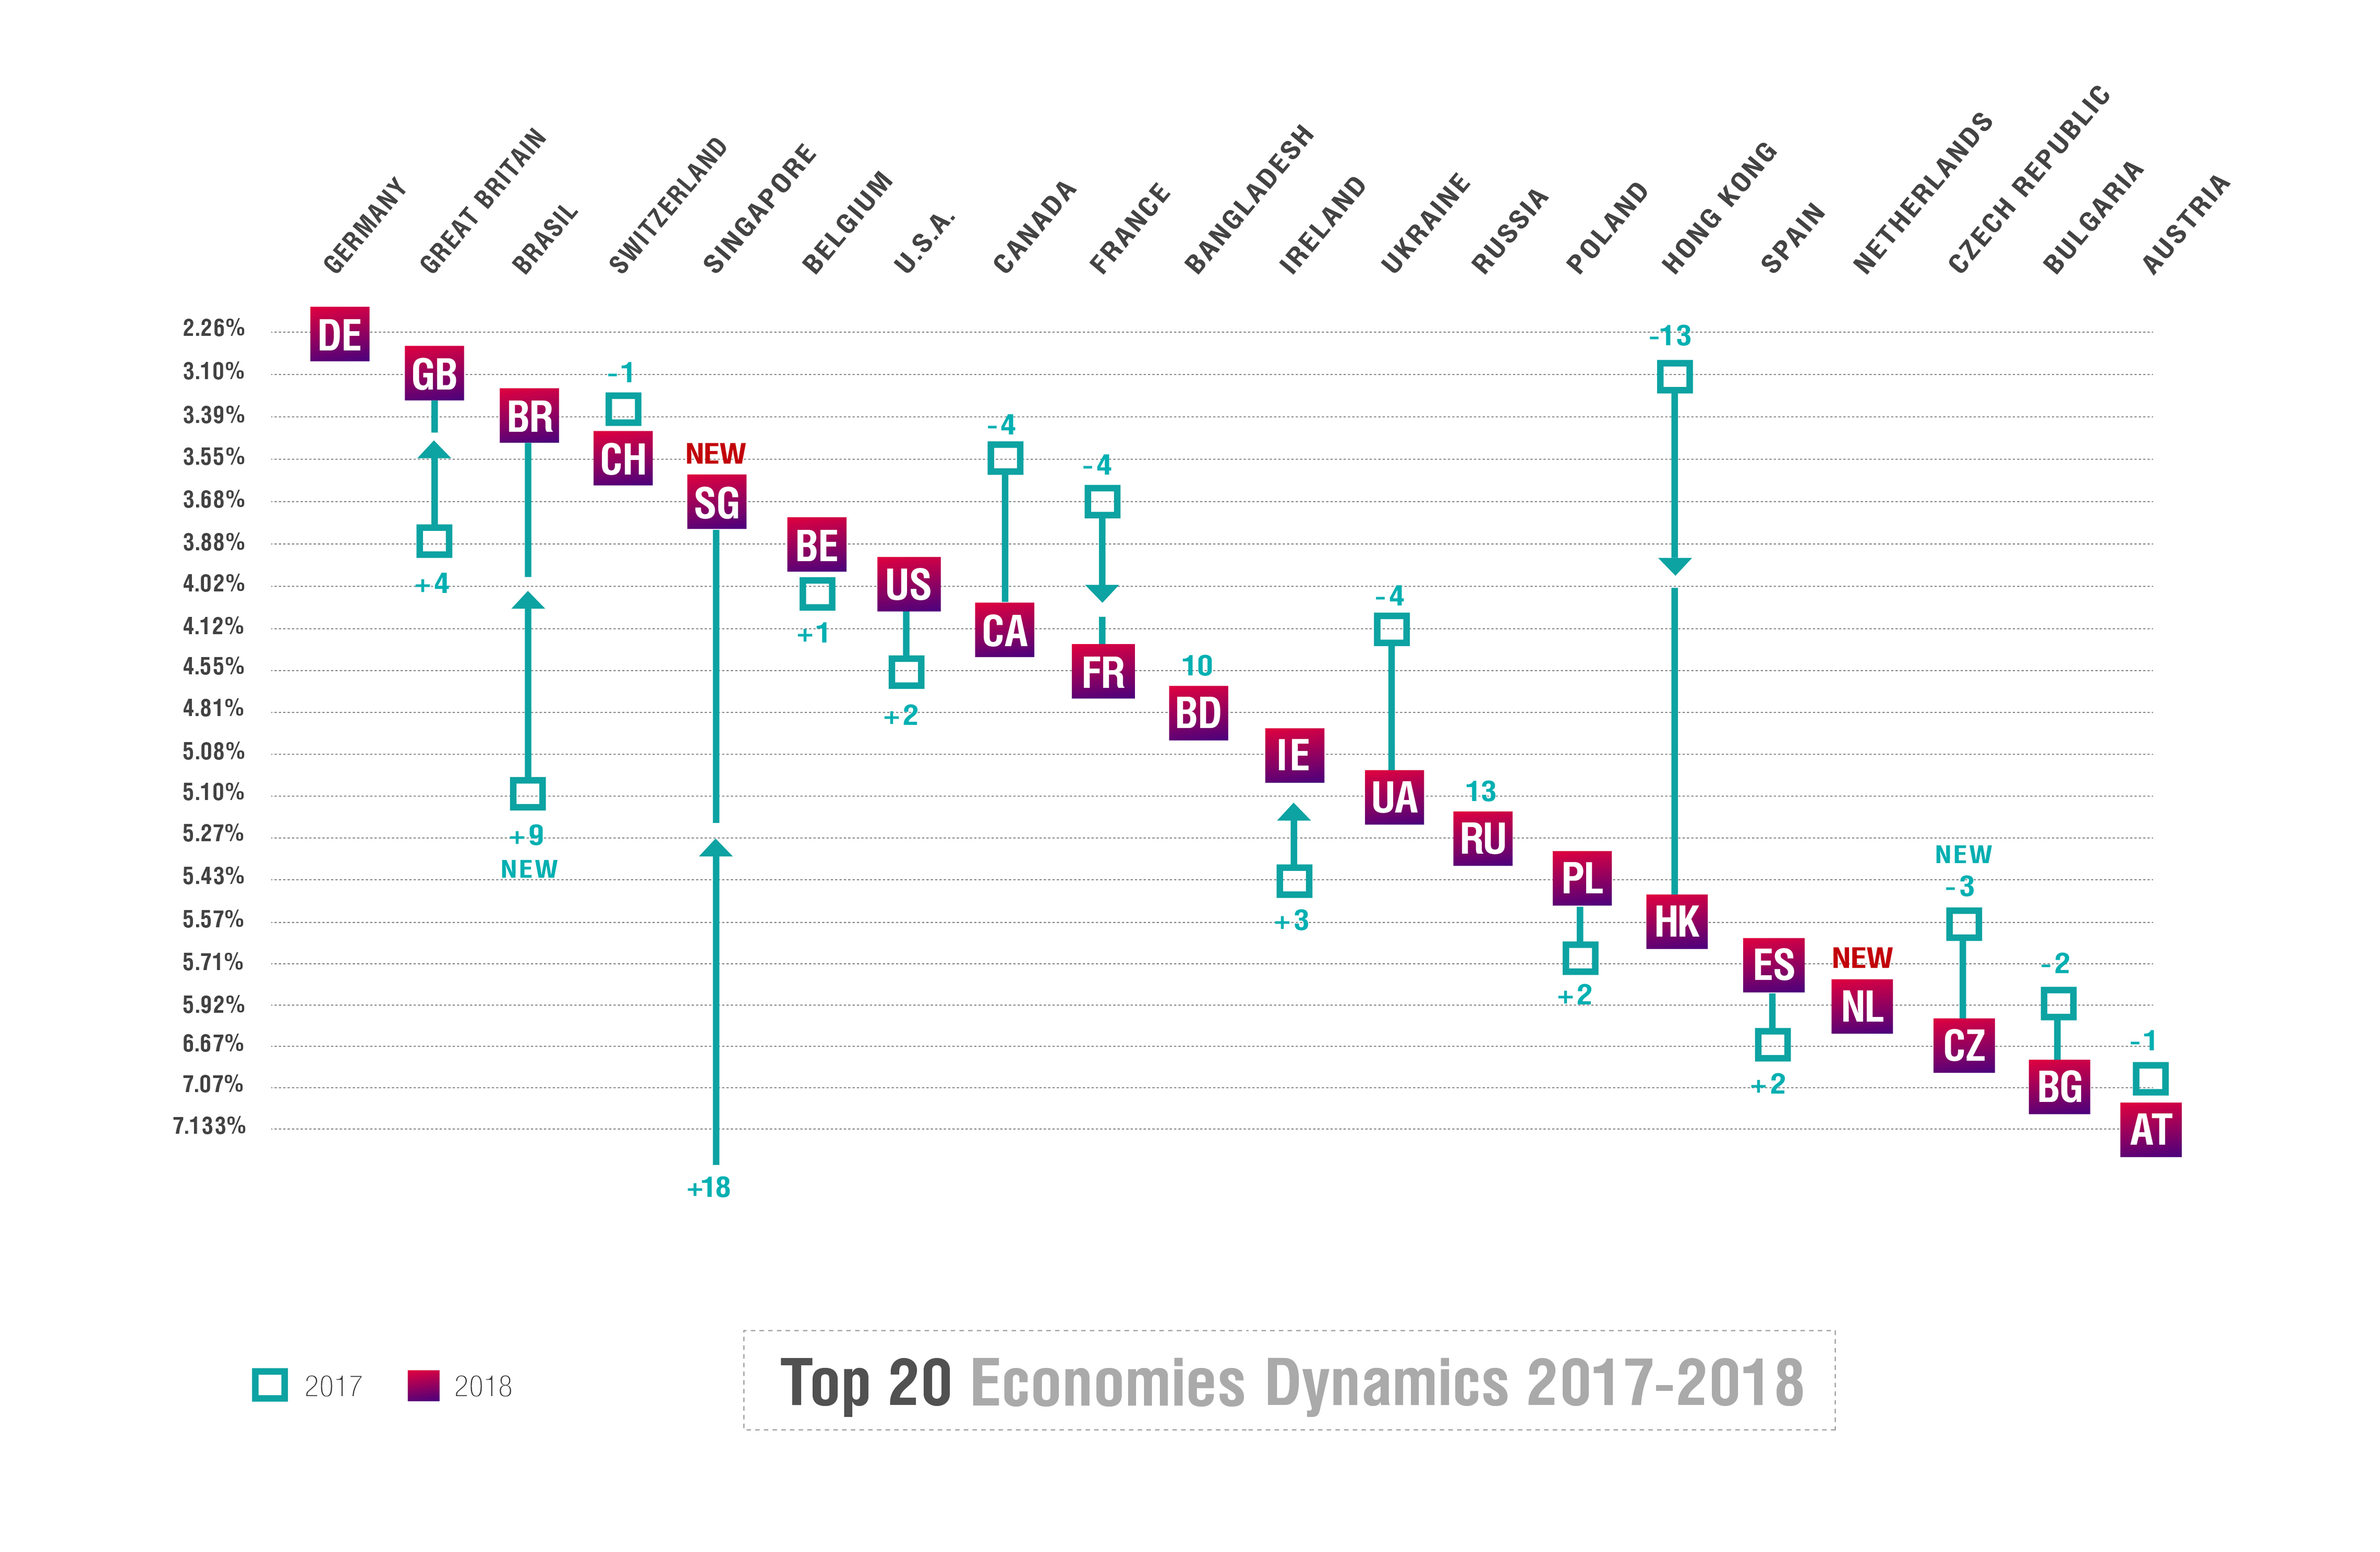
Figure 1 — Top 20 Economies Dynamics 2017-2018.
Quick observations:
- Romania and Luxembourg fell out of the top 20 from 11th and 20th place respectively, in 2017.
- Singapore jumped 18 places to 5th.
- Hong Kong fell 13 places to 15th.
- The Netherlands entered the top 20 for the first time in 17th place.
- 18 of 20 economies remained in top 20 compared to last year.
While individual economies may have moved up or down the list, overall reliability rate did not change significantly from 2017. Last year the average outage from a single failure was 41%; in 2018 it decreased by 3% to approximately 38%. The number of economies with an outage rate of less than 10% (indicating fault resistance) increased by one (n=30).
The primary trend for the year was found to be the significant reliability improvements in the small economies of South Asia and Africa. These regions are still developing, but strong improvements in IP transit market diversity are a sign of accelerating progress.
With regard to the Asian ISP market, we’ve observed significant changes over the last two years, with Hong Kong and Singapore exchanging places based on an index change of just 2% — there are some theories surrounding this change, which we’ve written about here.
The competition is fierce at the top of the reliability list, where positions are lost based on single digit percentage changes.
Game of IPv6
It is commonly believed that if a technology works well in IPv4, it could be easily ported to IPv6. This mistaken assumption may be the most significant structural problem of the whole IPv6 development process. And measuring Internet reliability for IPv6 hasn’t become an exception.
To maintain global connectivity in IPv4, it’s enough to maintain a single customer-to-provider path to one of the Tier-1 providers. But in IPv6 this may not be enough.
Due to ongoing peering wars between several Tier-1 providers in IPv6, they are not all connected to each other. At least two pairs of providers decided to ‘de-peer’ in IPv6: Cogent (AS174) and Hurricane Electric (AS6939); Deutsche Telekom (AS3320) and Verizon US (AS701). These Tier-1 providers may have different reasons for their conflicts, but if a network is connected only to one party in the conflict, it would not have full IPv6 connectivity. It also affects the reliability of ISPs with multiple upstream providers — the outage of one may already lead to connectivity problems.
To address these issues, we adjusted our measurement process to check whether full IPv6 connectivity is maintained during an outage. In other words, paths for all Tier-1 providers must be present to maintain full connectivity. We also calculated the percentage of ASes in the economy that have only partial connectivity due to these peering wars (Figure 1).
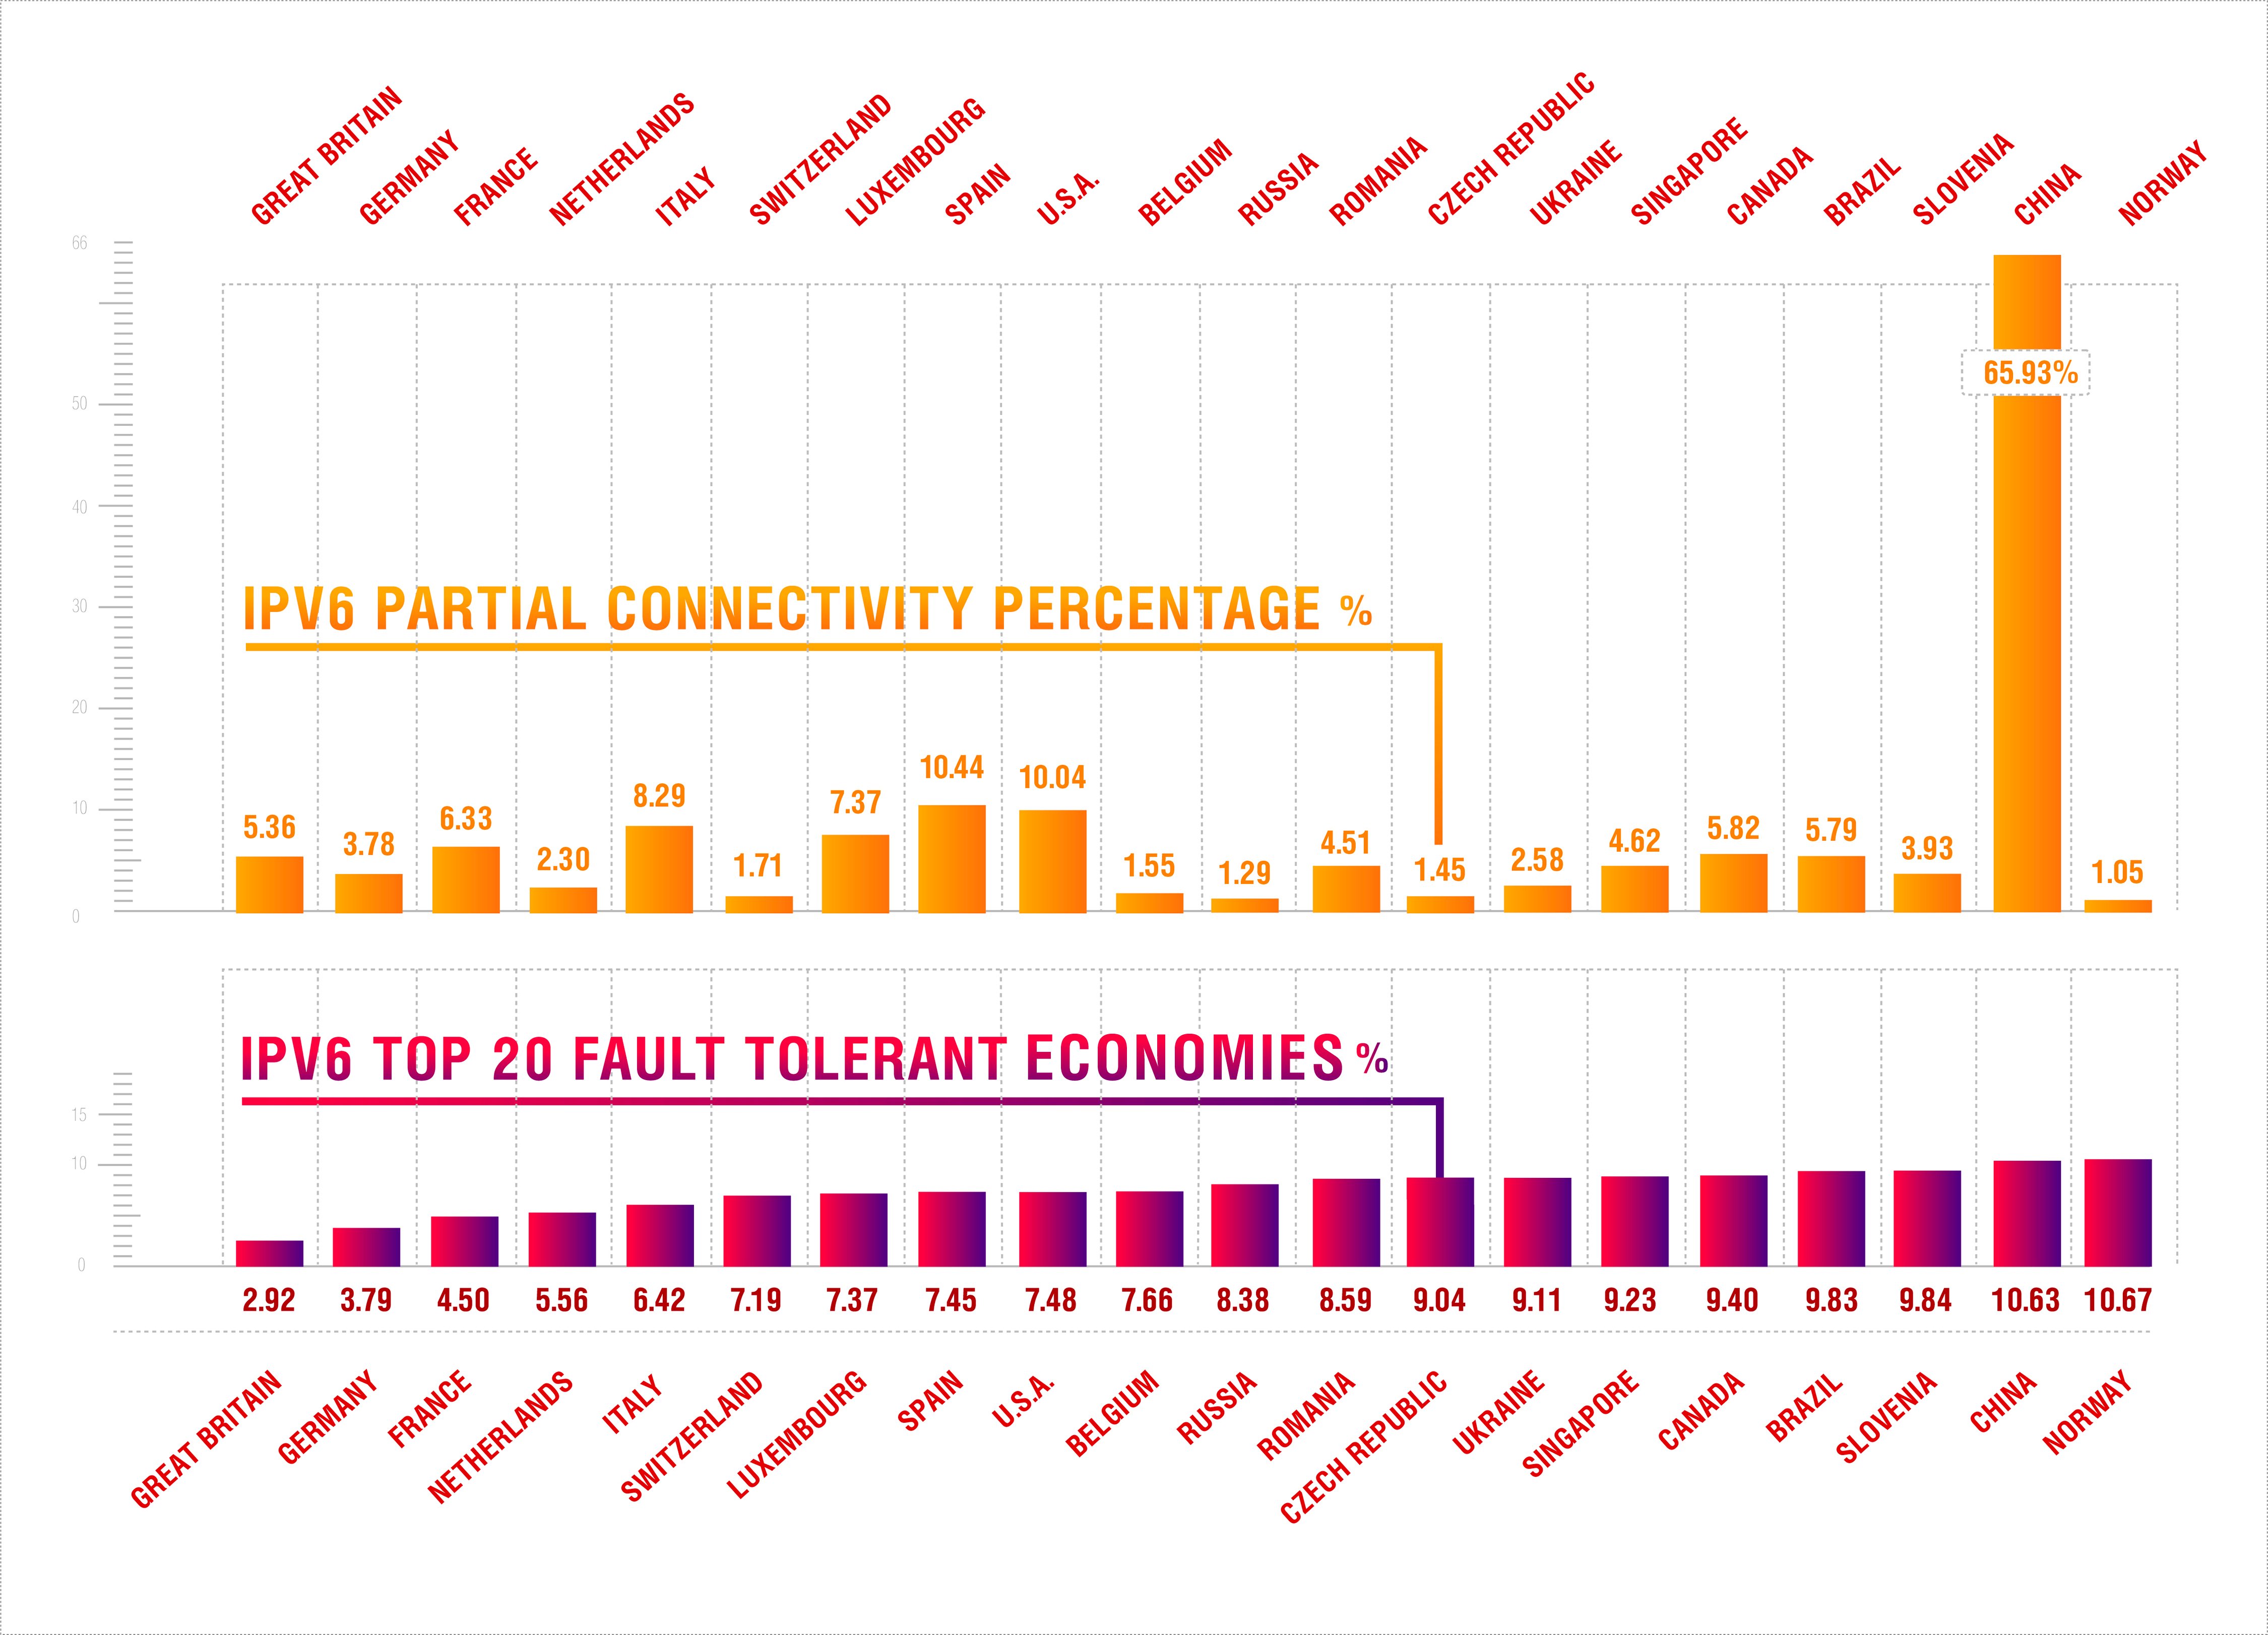
Figure 2 — IPv6 partial connectivity percentage (top) and top 20 fault tolerant economies (bottom).
The overall comparison of IPv4 and IPv6 in case of a single failure shows that for 86% of economies, IPv4 connectivity is more reliable.
An important discovery in the world of IPv6 is that many ISPs do not have proper connectivity under normal operating conditions without any outages. For example, in the US this applies to approximately 10% of all ASes that have IPv6 support, and in China, the situation is even worse: China Telecom (AS4134) is getting global IPv6 connectivity from only one provider, Hurricane Electric.
As stated above, nobody can force Tier-1 providers to peer with each other except their customers. Data clearly shows that user demand is not incentive enough for them to connect to each other and achieve 100% network visibility.
Explicit market calls for proper IPv6 service seem to be the only way to improve the situation. The Qrator.Radar team is considering different options to make this information transparent for every ISP in the world, thus improving community awareness of the problem.
Broadband Internet and PTR records
We believe that studying the diversity and reliability of the IP transit market in different economies can be quite useful in certain business scenarios. But there are different viewing angles — that is mobile users and broadband connections — and we can’t assume that they have uniform distribution among all ISPs in the region.
There are different ways to gather information related to Internet market shares. We tried to keep our study technical, therefore tried to find easy-to-check metrics that would correspond to some features of Internet markets. We tried to use different metrics: size of IP address space, DNS records, PTR records, pingable IPs and all its combinations. We found data gathered by Rapid7 Open Data quite useful at this stage of the research.
After many experiments, we determined that in the majority of regions there is a strong correspondence between the number of PTR records and broadband market share.
Using the distribution of PTR records, we decided to recalculate the reliability rating and compare results with the original one (Figure 3).
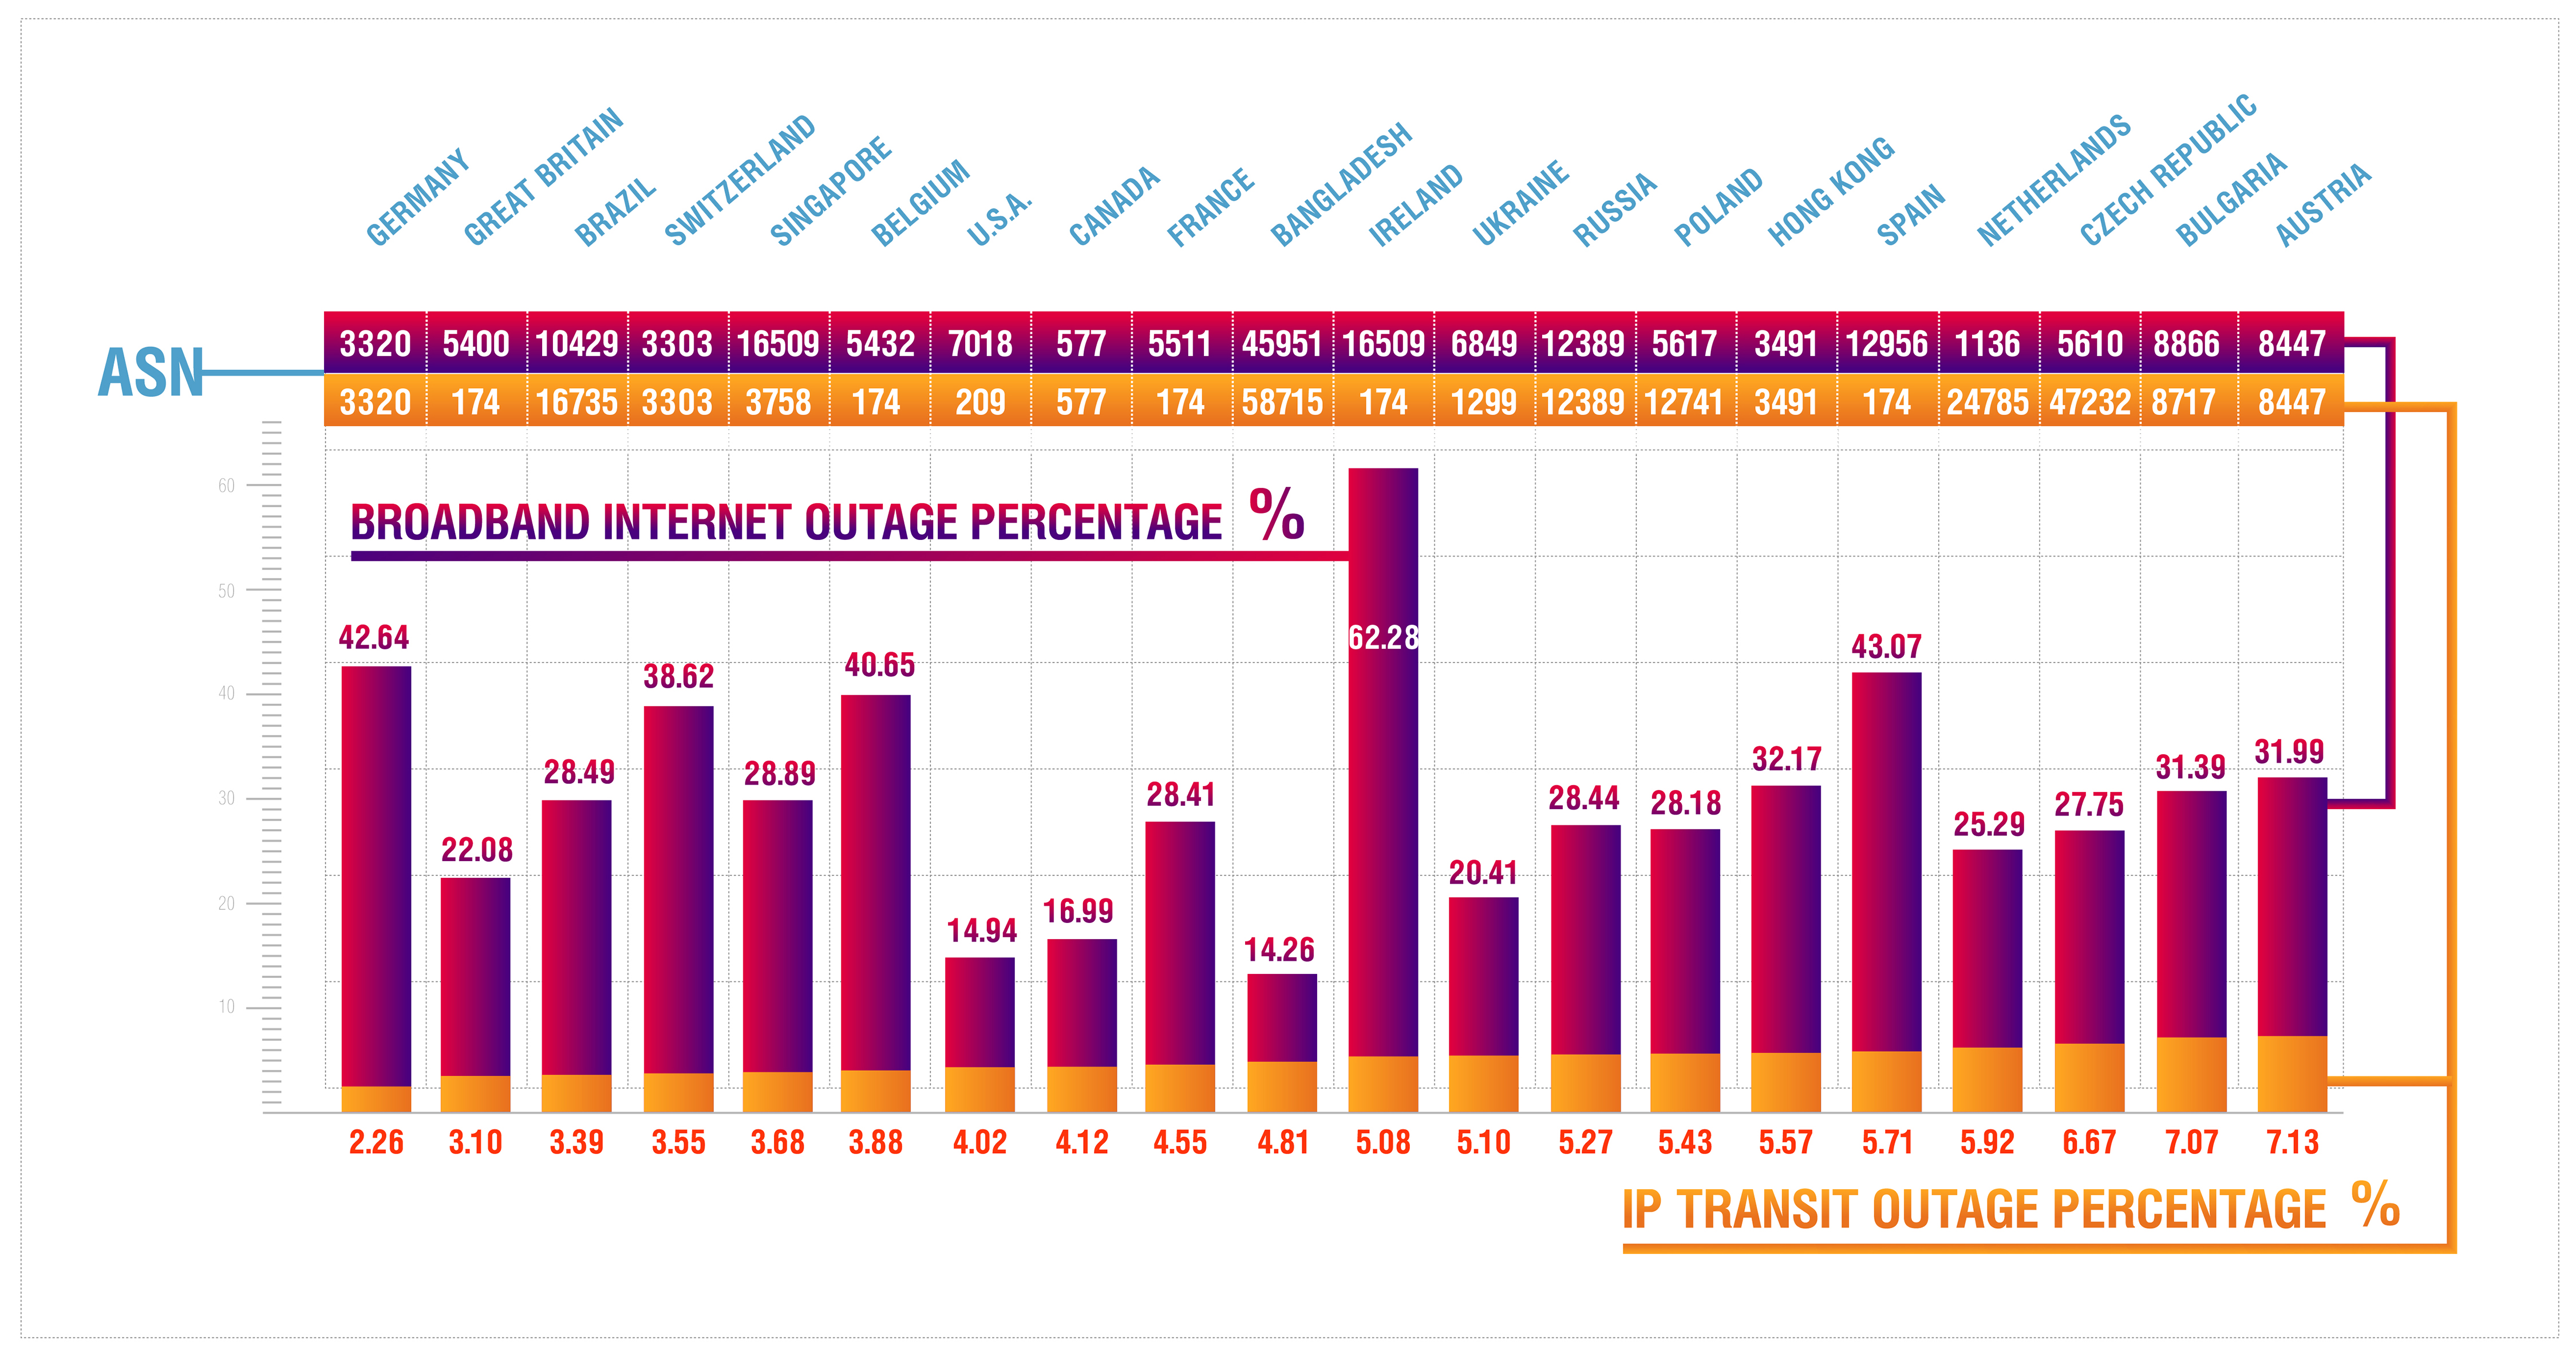
Figure 3 — Broadband Internet outage (blue) and the IP transit outage (yellow) percentage.
The results proved to be significantly worse compared to the reliability of the IPv4 transit marker; the average outage increased from 38% to 63%.
In some regions, the possible outage percent increased more than 10 times. For instance, the service degradation at Deutsche Telecom will affect 42% of broadband connections in Germany compared to 2.2% of affected ASes.
There is no surprise that some ISPs in certain economies, which experienced the biggest outages, have also changed. For example, in France, Spain and Great Britain, Cogent was replaced by Orange (AS5511), British Telecom (AS5400) and Telefonica (AS12956) accordingly.
This study highlights that even in economies with excellent IP transit market diversity, other Internet segments may be dominated by several or even single players. This creates additional operational risks that should be considered by any kind of service that is looking for constant availability in the selected region.
Summary
During this survey, we expanded our reliability research beyond the IPv4 transit market. We found a way to calculate the outage in case of a single failure for the IPv6 market, which proved to be still under development and can’t be called reliable in the majority of regions. The main reason is ongoing peering wars, and we hope customer demand finally fixes these issues.
We also tried to study other Internet markets, starting with the broadband Internet segment. We found a correlation between PTR records and broadband Internet market share in many regions, but there were also exceptions. We’ll keep studying this curious relation to get even more robust metrics. But its usage has already highlighted a certain disproportion of the broadband Internet market in selected regions.
Contributors: Alexander Kozlov
Adapted from original post which appeared on Radar, Qrator Labs’s Blog.
Alexander Azimov is network architect at Qrator Labs.
The views expressed by the authors of this blog are their own and do not necessarily reflect the views of APNIC. Please note a Code of Conduct applies to this blog.