

In a recent study [pdf], ICANN examined how to develop a new metric that could passively and continuously track incoming traffic to ICANN Managed Root Servers (IMRS). The goal was to develop a metric that indicates which Autonomous Systems (ASes) might benefit from new instance placements, better peering, or simply additional investigation or scrutiny. This post is adapted from that study.
There are various motivations for deploying anycast instances for IMRS. Instances may be placed on behalf of a community request or to support developing regions. Other instances are large clusters that support the wider community in a region. This analysis neither includes these instances nor takes these factors into account. Therefore, the results can suggest how to optimize the future placement of IMRS instances that serve specific ASes.
Methodology
We will use the hop count in the IP header of DNS queries as an indication of how many hops are placed between an instance and ASes. Hop count is not equivalent to latency time measurements. While there is a positive correlation between hop count and latency along a given route, this relationship can be quite different depending on the route used. However, due to the complexity and scale of latency time measurements, as well as the need for a passive method that can be continuously deployed, we will focus on studying the hop count as a metric. An extreme way to achieve the best placement in terms of latency would require placing an IMRS instance in every AS. This would also ensure the lowest possible hop count. However, this option is neither feasible nor desirable.
As of 8 June 2020, there are more than 162 IMRS instances for the 68,578 ASes in the global routing system. ASes are not all equal and do not represent the same number or volume of clients. We also know that there are resolvers from thousands of different ASes that might prefer an IMRS instance because that instance is closer to the ASes than instances from other root server operators.
However, if we assume that a query that encounters a lower-than-average number of hops has a better proximity of placement to an AS or a client, we can also assume that a lower hop count correlates well with a more ideal placement.
We can calculate the total number of hops travelled by all DNS queries arriving at an instance. We can also calculate the average hops counted for all queries for each prefix and for each AS. Instances that have a higher-than-average hop count and query load are instances that contribute significantly to the total number of hops travelled by queries to those instances.
Mapping addresses to ASes
In general, routing between interconnected networks is done via the Border Gateway Protocol (BGP), which uses AS numbers (ASNs) to determine a path to a prefix. The generally accepted minimum prefix size to be routed in the default-free zone for IPv4 is a /24 and for IPv6 is a /48. Therefore, we can first aggregate addresses according to their routing prefixes, and subsequently, aggregate routing prefixes according to their ASes.
To map routing prefixes to an ASN, we use a table that maps prefixes to the origin ASN, derived from BGP routing tables collected from the APNIC router at DIX-IE (formerly NSPIXP2) in Tokyo. The purpose of using this specific data set is that APNIC provides historical data, one table per day. We can thus map the routing prefixes obtained from IMRS traffic to ASNs using routing tables from the same day. While routing tables change throughout the day, the routing prefix-to-origin ASN mapping is almost always stable.
Hop count
We use the time to live (TTL) field in a IPv4 packet header and ‘hop limit’ field in a IPv6 packet header to determine the hop count. The value of this field is decremented when an IP packet passes through a router. The starting value of this field varies between systems, but modern systems default to a multiple of 32 for the value. Limiting the observation to the five least significant bits of this value gives an upper bound of 31 hops.
For the purpose of this document, we will simply refer to this value as the hop count and regard a lower value as fewer hops travelled, which means that we subtract a specific hop count value from 32. An IP packet may have been tunnelled over more hops than indicated in the hop count. Technologies such as virtual private networks and software-defined networking may have occluded the number of real hops that were traversed. However, since the hop count value only increases, it represents the minimum value of the actual hops encountered.
Remember that although hop count values never decrease, they are derived from TTL and hop limit fields, which decrease as they pass through routers. A given IP packet, therefore, shows the minimum number of observed hops in its IP header even if it may have been tunnelled.
Hop count as cost factor
If we assume that the more hops a query encounters the more costly it is, a well-placed instance will have the most queries travelling the fewest number of hops. By using these assumptions, we can rank traffic at IMRS instances by the total number of hops of all of the observed queries encountered. Similarly, for a given IMRS instance, we can rank ASes by the total number of hops that all of the observed queries originating from the AS have encountered. ASes that have resolvers, which consistently generate queries with high value hop counts in addition to a high volume from the AS as a whole, are candidates for further research.
Minimum hop count
Within the same prefix, hop counts may differ between queries because they use disparate resolvers and are in different networks. As a simplification, we use the lowest hop count observed in a prefix as the hop count for all queries within that prefix. Similarly, hop counts may differ between routing prefixes associated with a single AS. We use the lowest hop count for all routing prefixes in an AS as the hop count between the AS and our instances. This hop count is used as the hop count for all queries with that AS.
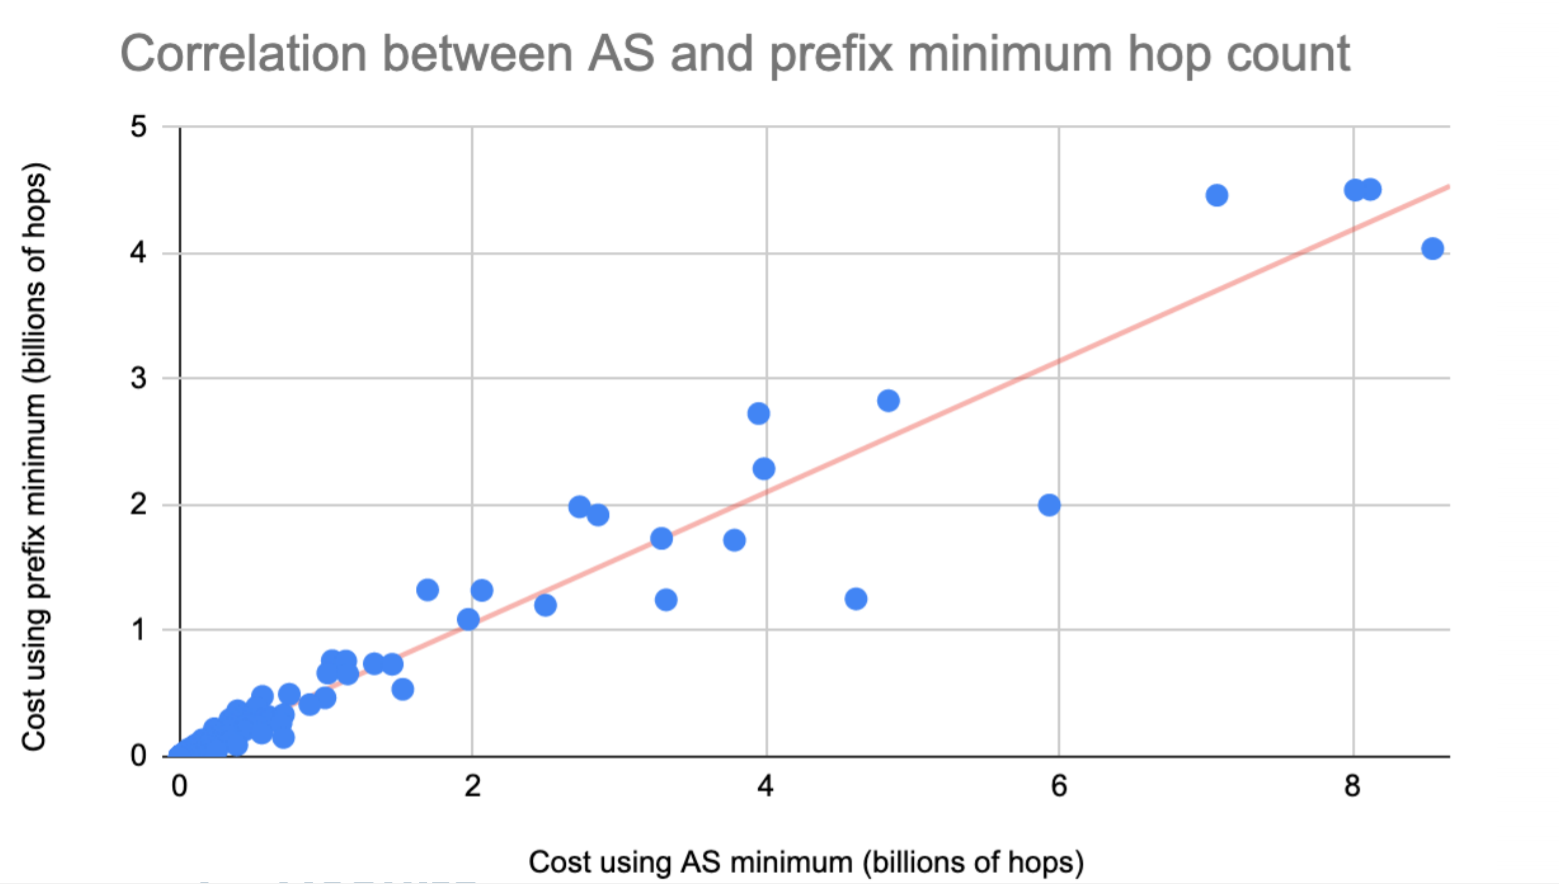
Correlation between hop count per routing prefix and AS
In our cost factor calculation, we used the hop count for all the queries that were coming from an AS, and then multiplied the number of queries from that AS by this hop count value. Instead of hop count observed per AS, we could use the hop count observed per routing prefix, and then multiply the number of queries from that routing prefix with this hop count value, and subsequently, add all of the resulting values for an AS. As long as there is a strong correlation between the two methods for the cost calculation, it should not influence the ranking. Figure 1 shows a strong positive correlation between the average routing prefix hop count and the average AS hop count for each instance. There are other ways to correlate this, but they all tend to have similar correlation coefficients.
Results
When we calculate the total number of hops for all the queries and divide it by the total number of queries, we have the average hop count for all the IMRS instances. For instance, the total number of queries on 4 May 2020 was 16.2 billion. The total hops counted in all the queries combined, using the lowest hop count for each AS for that day was 60 billion. The average hop count for all of IMRS that day was 3.7 hops per query. For each AS, we counted the volume of queries. We then multiplied this volume by the lowest hop count observed for that AS.
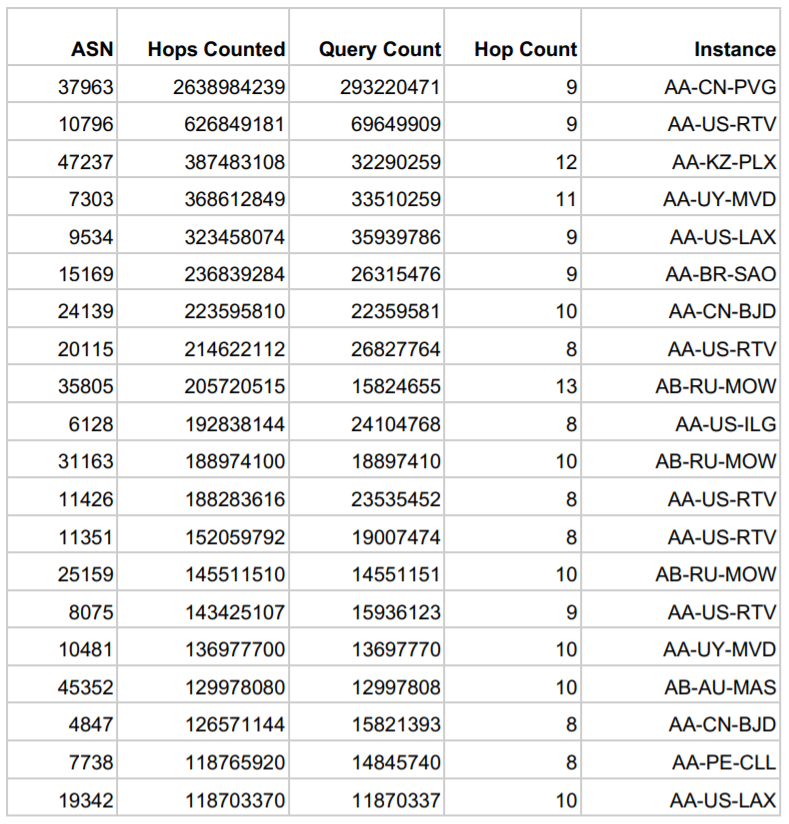
We noticed that some routing prefixes and ASes appear in more than one instance, which is something we need to research further. Additionally, we were not able to map some routing prefixes to ASNs. We then focused our analysis on ASes, in which the total number of hops counted is high. This method allowed us to focus on ASes with the highest overall query cost. In theory, they are in a topological location that sends a large amount of queries to topologically remote instances.
In the table below, we list the top 20 ASes with a hop count of at least eight, which is more than double the average overall hop count. These ASes produce a significant amount of traffic and are relatively distant from the instance they communicate with. These ASes deserve additional scrutiny.
Conclusion and next steps
The results of this study show that using the lowest observed hop count as an indicator of minimum distance could be used to calculate the cost of serving an AS. If this cost is high, the number of hops travelled by all of the queries is high, and the AS has a higher than average minimum hop count because it is topologically remote from an instance. The AS may be better served by having its own IMRS instance, or by having a new IMRS instance that is topologically closer to it than those currently available.
While data from 4 May 2020 was used for this document, future optimal placement testing could use historical data, which goes back to 1 December 2019. A next step in this research could be to see how traffic patterns change when new instances are introduced.
Additionally, it is important to get a richer routing prefix-to-ASN mapping to ensure that all observed addresses can be mapped appropriately.
More importantly, when there is a desire from the community to have an instance deployed because of a perceived placement improvement, the current and past ‘cost’ in terms of hosts counted of this AS can be determined using the tools built for this study. If there are no improvements because, for example, the current hop count for this ASN is already lower than the average, the priority for deployment in this AS could be lowered, absent any other criteria for deployment. For instance, if any of the ASes in the table above would desire an instance, it would be a clear benefit for these ASes, because they currently are topologically remote from any IMRS instance and have a high load on the current IMRS instance.
Any AS would in theory benefit from a local IMRS instance, but implementing that strategy would simply not scale. It is thus important to determine how much the individual AS and the IMRS instance used by that AS gain by placing a local IMRS instance.
Finally, the next step in this study could be to build a system that continuously and automatically observes queries at IMRS instances and ranks individual ASes and prefixes using IMRS traffic and route tables. These rankings, which are similar to the table in this post, could be included in the dataset that is currently published in Identifier Technology Health Indicators (ITHI), an ICANN initiative to ‘measure’ the ‘health’ of the ‘identifiers’ that ‘ICANN helps coordinate‘.
A note on measuring query latency:
It is impossible to passively determine query latency between a client and an IMRS instance, because a query is observed only once at an IMRS instance. Most IMRS instances are hosted under contract with independent entities. While it is technically possible to actively contact clients from IMRS instances to determine query latencies, doing so violates the spirit of the contracts between ICANN and the instance operators. Lastly, it is possible to determine query latency for queries that arrive over the Transmission Control Protocol (TCP), by analysing the latency between IP packets that form a TCP handshake. Currently, however, the method used for capturing DNS messages does not record this latency. Furthermore, at a higher level, we do not know if the latency of traffic over the TCP is representative of traffic over the User Datagram Protocol (UDP). This may be an interesting avenue for future study.
This blog post was adapted from the IMRS Instance Placement Study (opens as PDF) which is part of ICANN’s Office of the Chief Technical Officer (OCTO) document series.
Roy Arends is Principal Research Scientist at ICANN.
The views expressed by the authors of this blog are their own and do not necessarily reflect the views of APNIC. Please note a Code of Conduct applies to this blog.