This year for FILE Electronic Language International Festival at FILE SÃO PAULO 2016 - come cross the limit some intothecontinuum GIFs were displayed as part of FILE GIF 2016 – patterns as time paradox: between transience and permanence as curated by Fernanda Albuquerque de Almeida.
Check out the full 240 page book cataloguing this years festivities and exhibitions here! They had some nice things to say in highlighting the GIF “Dust Loops” below:
FILE GIF 2016 – patterns
GIF as time paradox: between transience and permanencePatterns are repetitions that occur in time. There is no realization of a pattern without the temporal element that makes possible the perception of something that repeats. Time, on the other hand, is unfathomable. We develop strategies to perceive it, demarcating seconds, minutes, hours and years. We think we can preserve it somehow, such as when we use photography to recall a moment that is gone. However, the reality is that time escapes us all the time, at every breath.
The perception of time has been problematized by many theorists that study the impact of technical and technological inventions in our everyday life since the end of the 19th century with the Industrial Revolution. With the advent of the telephone and television broadcasts, the exchange of information starts taking place “live”. If before we would take days, weeks or months to receive some information, now, with internet and mobile devices, this information becomes available almost at the same time that it is produced for geographically distant locations. Time and even space become ubiquitous.
GIFs are a typical phenomenon of the ubiquitous online networks in the early 21st century. Invented in the late 1980s, they were a way to produce, transmit and store images in low resolution compatible with the technology of the time. Today, this objective was diluted and they represent the dissemination of patterns that, precisely because of its scope, communicate with much of the web users, becoming memes, cultural phenomena whose information is propagated through the internet with great impact, viralizing. As soon as they are produced and disseminated, these memes are lost because of their ephemeral nature, but do not cease to exist. Thus, like memes, we can say that GIFs are paradoxical. Ephemeral and permanent, that is, related to patterns, therefore, to something that is formed on time, even if that time is short and ubiquitous.
GIFs and memes are generally produced by anonymous, but, increasingly, there are artists that choose this way to develop their poetic. In this edition of FILE, we present a selection of more than 40 proposals that emphasize the own medium structure addressing patterns, emphasizing or breaking them, whether they are behavioral (individual and social) or formal.
The highlight of the exhibition is “Dust Loops”, by Sumit Sijher. As the name suggests, the GIF contains points that move along the frame as dust particles. The movements seem chaotic and random, but the sequence has only 20 frames that repeat in 2 seconds. This makes curious the fact that we cannot follow the complete trajectory of a particle over these 2 seconds, not even over 10 or 60. According to the artist, we would need half an hour for this. This GIF meets the proposal of this exhibition, for time here is fundamental for its comprehension. It is a way to expand the notion of GIF, whose visualization usually is very brief, as well as its creative possibilities.
The production of Sijher and of all the other artists in the exhibition can be found online, spread through the internet in several sharing websites and platforms. They represent part of the diversity of GIFs produced in recent years, which result from different creative processes with algorithms, photographs, drawings and animations, but have in common the repetition that occurs in the physical and online networks.
- Fernanda Albuquerque de Almeida
FILE GIF 2016 Curator
For reference sake, you can find the particular intothecontinuum GIFs and their abstracts that appeared in FILE, and the corresponding Mathematica code on this Tumblr blog here:
“Dust Loops”
“The seemingly random and chaotic motion of 5,000 particles are captured in just 20 frames which repeat in a mere 2 second long loop, but results in a much longer apparent motion. If the motion of any single particle is followed it takes about 30 minutes for the particle to return to its original location.”
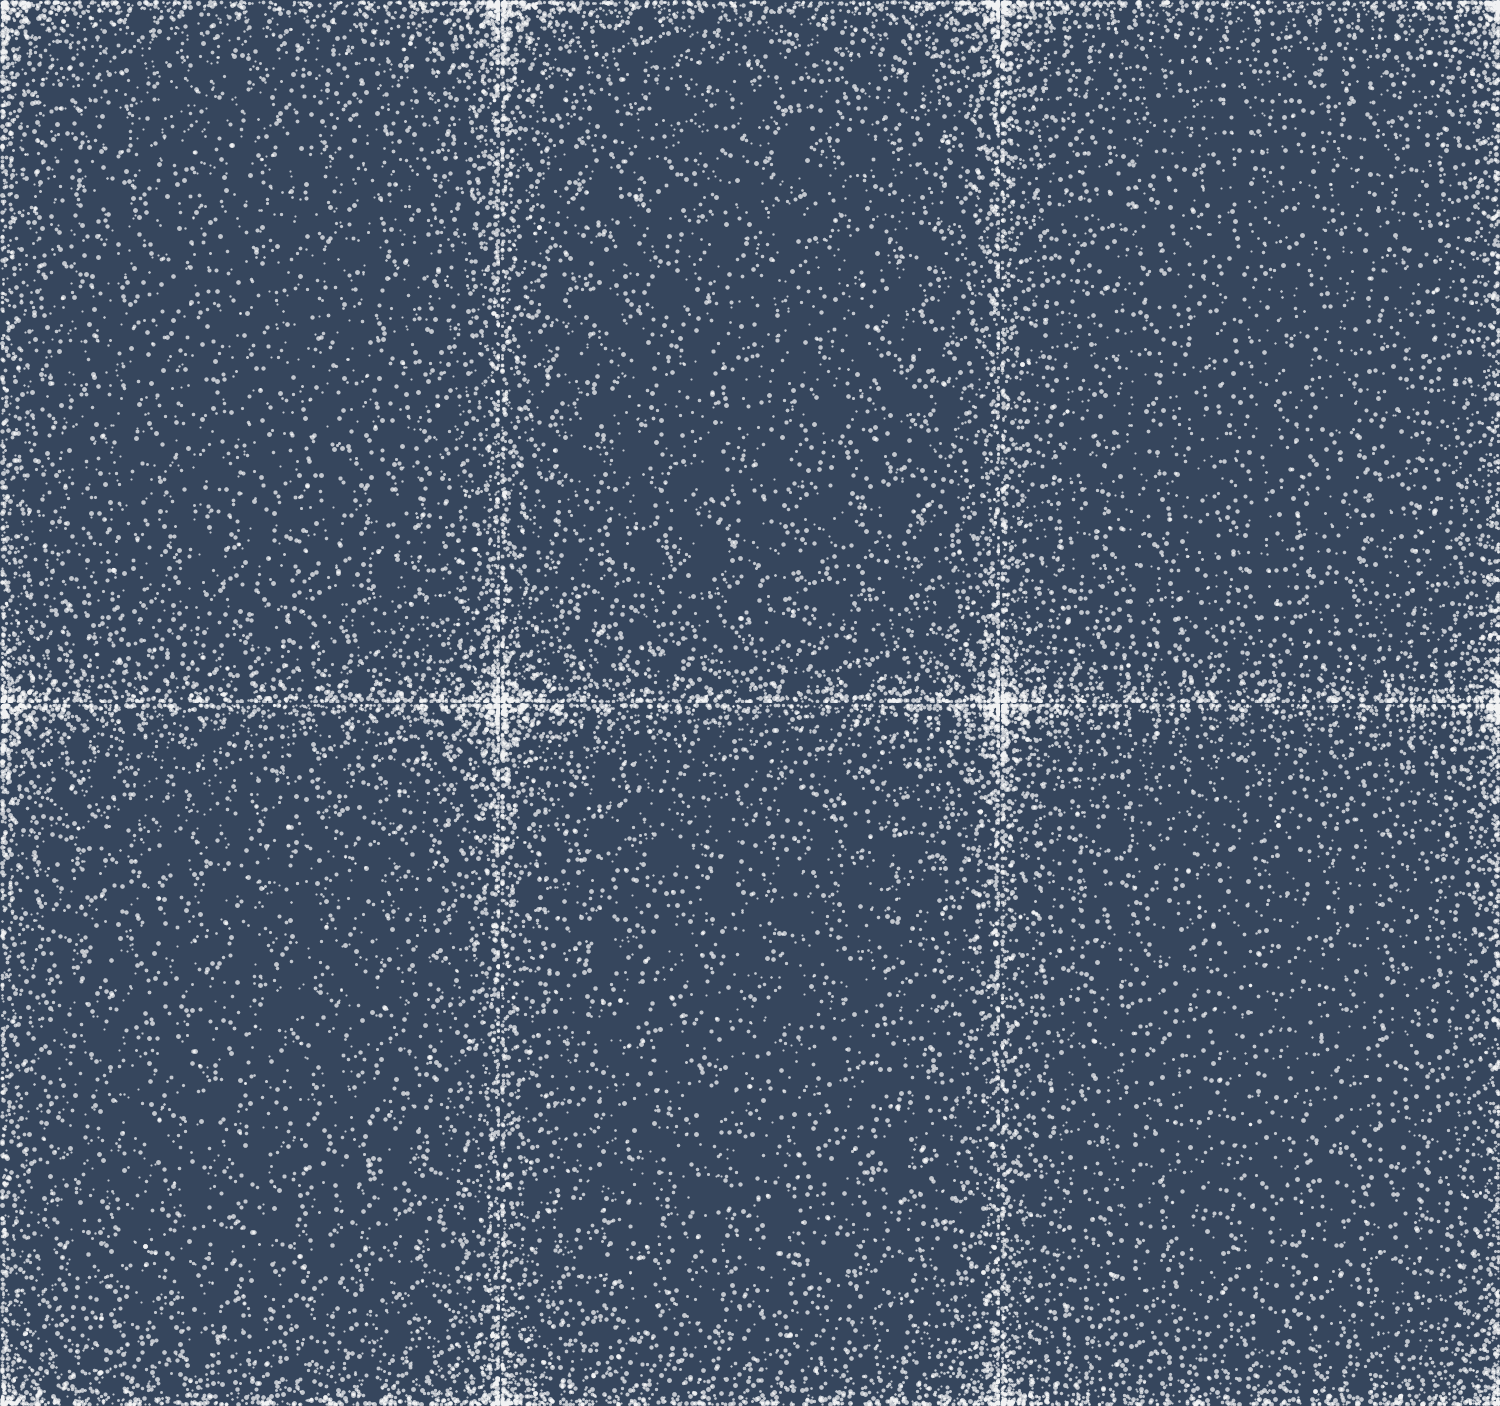
Mathematica code:
G[p_, q_, a_, b_, c_, t_] :=
 Graphics[
  Table[
   {Opacity[.7], White,
    Disk[
     {.71*Cos[a (.05*t + n)*Pi/500 + p],
      Cos[b (.05*t + n)*Pi/500 + q]},
      .002*Cos[c (.05*t + n)*Pi/500] + .005]},
   {n, 1, 1000}],
  PlotRange -> {{-.715, .715}, {-1.005, 1.005}},
  Background-> RGBColor[54/255,70/255,93/255],
  ImageSize -> 500]

Manipulate[
   Show[
    G[0, .2, 29, 13, 11, t],
    G[0, .2, 19, 31, 9, t],
    G[.3, .29, 3, 23, 17, t],
    G[0, .3, 43, 7, 3, t],
    G[.1, .13, 31, 19, 2, t]],
{t,1,20,1}]
“A stack of blocks spin around at varying speeds: relative to the 1st block at the bottom of the stack, the 2nd block spins twice as fast, the 3rd block spins three times as fast, and so on… The overall motion results in fluctuating moments of order and disorder in the overall structure as it continuously twists about itself.”
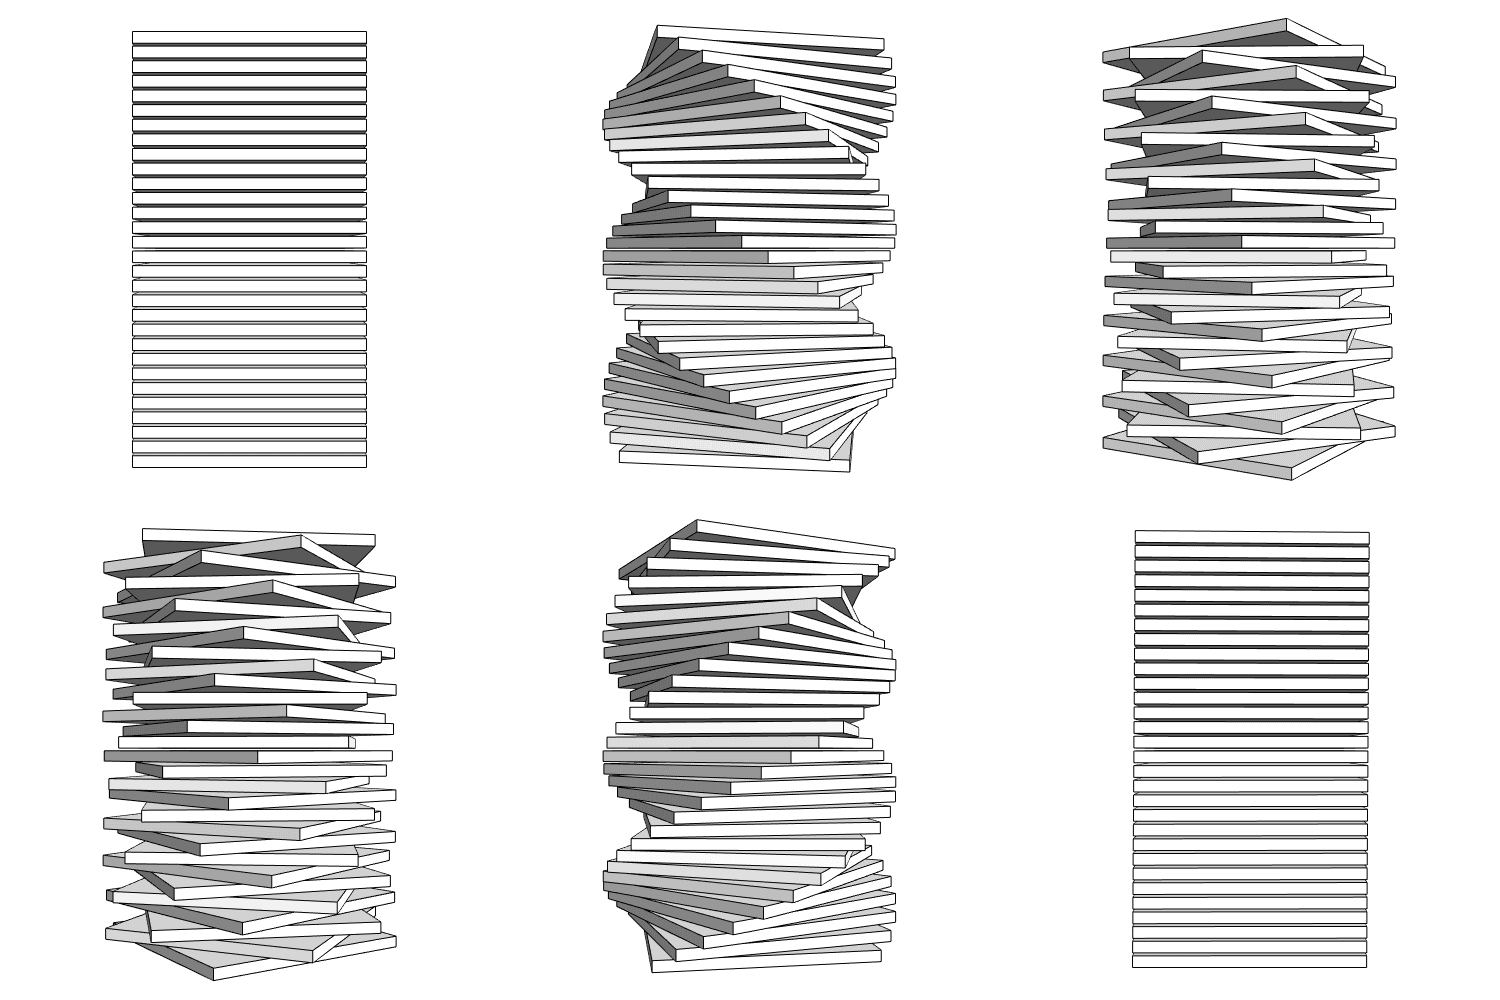
Mathematica code:
v[x_, y_, z_] =
  Flatten[Table[ {(-1)^i*x, (-1)^j*y, (-1)^k*z}, {i, 0, 1}, {j, 0,
     1}, {k, 0, 1} ], 2];

f = {{1 , 2 , 4 , 3  }, {1 , 2 , 6 , 5  }, {5 , 6 , 8 , 7  }, { 3, 4 ,
     8 , 7  }, { 1, 3 , 7 , 5 }, { 2, 4 , 8 , 6  } };

G[x_, y_, z_, s_, H_ , t_] :=
 Table[
  Translate[
   Rotate[
    GraphicsComplex[v[x, y, z], Polygon[f]],
    h (Cos[t] + 1) Pi/4, {0 , 0, 1 }],
   {0, 0, s*h}],
  {h, 1, H}]

Manipulate[
  Graphics3D[
   G[2, 2, .1, .25, 30, t],
   Lighting -> "Neutral", ViewPoint -> Front, ViewAngle -> 35 Degree,
   Boxed -> False, ImageSize -> 500],
  {t, 0, Pi}]
“Using algorithmic randomness, various colored disks fade in and out while conforming to a 13-fold rotational symmetry giving the appearance of a kind of flower in a state of perpetual bloom.”
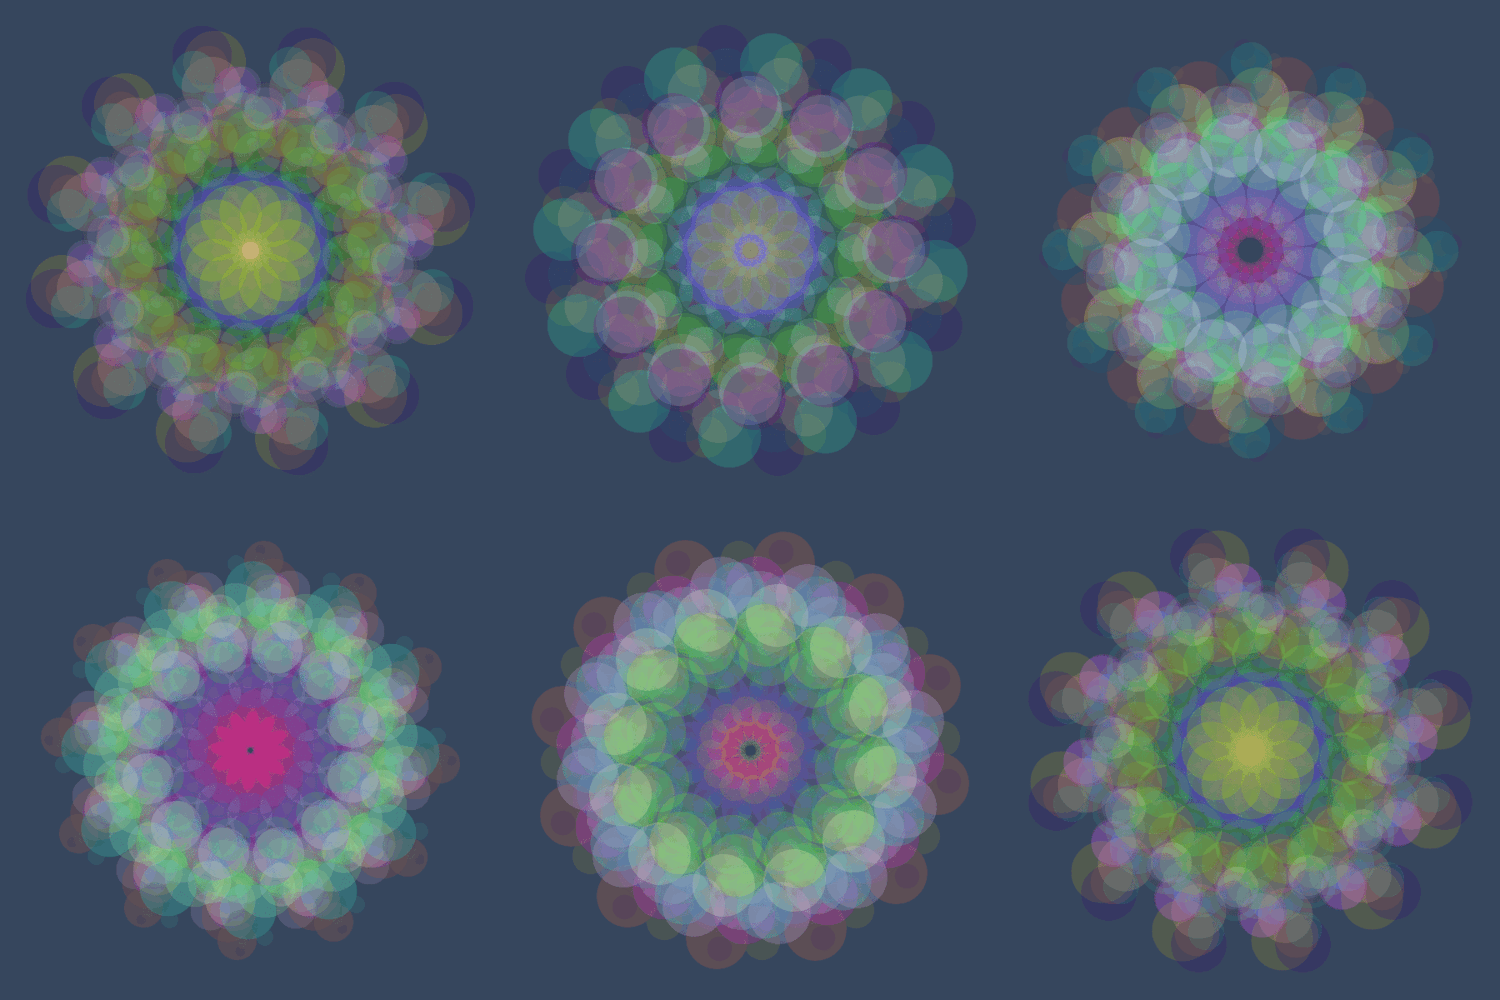
Mathematica code:
RR[n_, m_] := (SeedRandom[n*m]; RandomReal[])

L[t_, Q_, g_, i_] := Sum[ Exp[-(t - (RR[i, 5*Q] + j))^2/g], {j, {-1, 0, 1}}]

G[c_, F_, P_, s_, o_, g_, A_, a_, w_, t_, r_, Q_, pr_, is_] :=
 Graphics[
  Table[
   Table[
    {RGBColor[RR[i, Q], RR[i, 2*Q], RR[i, 3*Q], o + A*L[t, 5*Q, g, i]],
     Disk[
      RotationTransform[(k + (-1)^(i*w)*t*a)*2 Pi/F]
       [{r*RR[2 i, 4*Q], r*RR[2 i + 1, 4*Q]}], s*L[t, 5*Q, g, i]]},
   {k, 0, F - 1, 1}],
  {i, 1, P, 1}],
 PlotRange -> pr, ImageSize -> is,  Background -> c]


Manipulate[
   G[RGBColor[54/255, 70/255, 93/255], 12, 50, .2, 0, .1, .25, 1, 1, t, 1, 76, 1.6, 600],
   {t, 0, .96, .04}]
“A series of bell-like curves sway back and forth while being overlayed vertically, and having their motion slightly out of phase from the preceding layer. The resulting dynamics reveal apparent motion in both directions along the vertical; however, as made evident by the static horizontal lines, nothing is actually moving up or down in the visual field.“
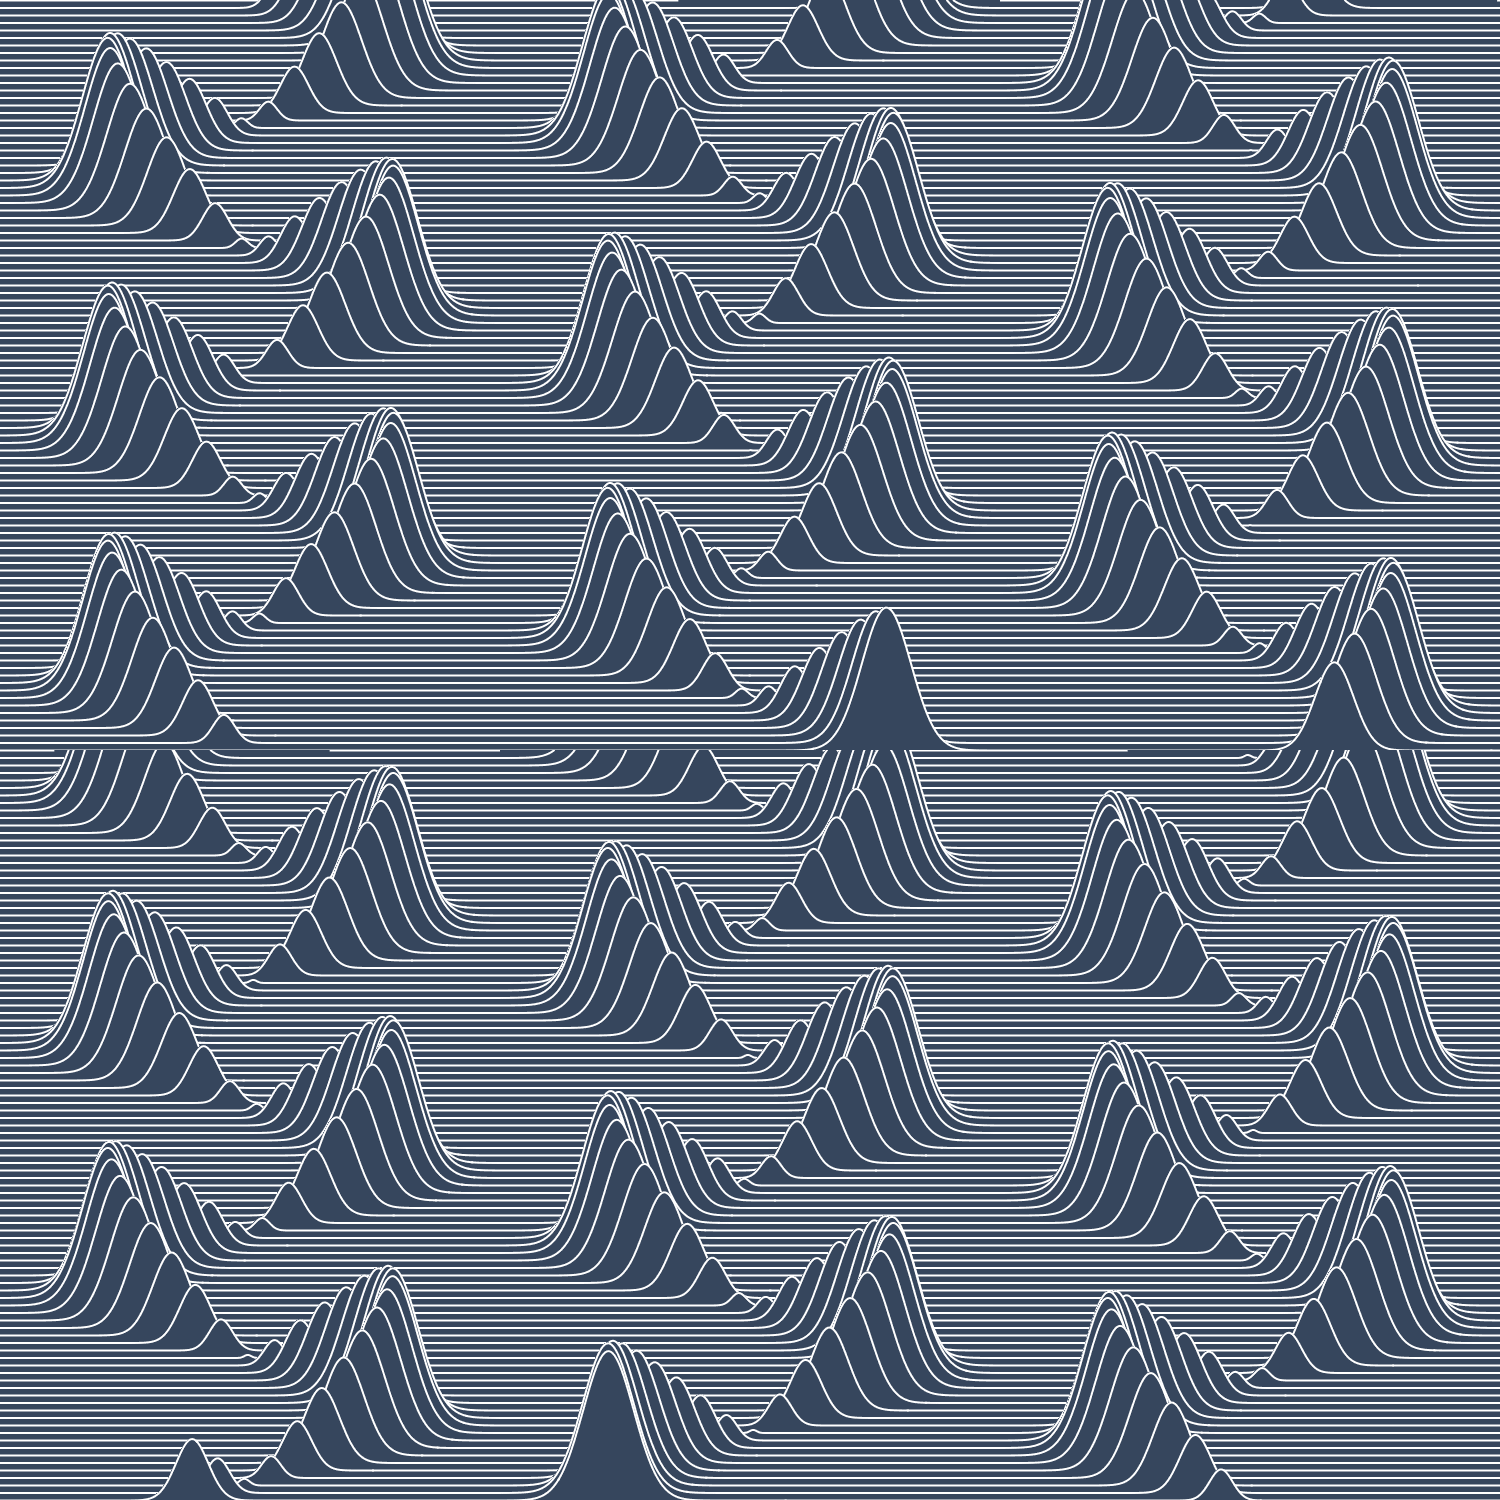
Mathematica code:
S[n_, t_] := Sin[n*3 Pi/50 + t];

Manipulate[
 Show[
   Table[
    Plot[
     100 - n + (20*Abs[S[n,t]] + .02)*Exp[-(x - 4*S[n, t])^2/Abs[S[n,t]]],
     {x, -10, 10},
    PlotStyle -> Directive[White, Thick], PlotRange -> {{-7, 7}, {0, 100}},
    Filling -> Axis, FillingStyle -> White, Axes -> False, AspectRatio -> Full,
    ImageSize -> {500, 750}, Background -> RGBColor[54/255, 70/255, 93/255]],
  {n, 1, 100, 1}]],
{t, .001, 2 Pi + .001, (2 Pi + .001)/30}]

If you happen to be in Amsterdam this July 11th, be sure to check out some intothecontinuum GIFs amongst many other international artists at GIF ME FASHION, a fashion GIF exhibition curated by Fleur van Maarschalkerwaart (Studio Ultradeluxe) and Fiona Makkink, at Fashion Week Amsterdam as part of FUTURE GENERATIONS “The Next Day”, Westergasterrein - Transformatorhuis
some Visual Insight regarding kaleidocycles from the enlightened, John Baez, over at the American Mathematical Society Blog: http://blogs.ams.org/visualinsight/2015/12/15/kaleidocycle/
Mathematica code:
hthr = Import["hthrtzy.jpg"];

hthrC = ImageData[hthr, "Byte"];

hthrG = ImageData[ColorConvert[hthr, "GrayLevel"], "Byte"];

L = Length@hthrC;

waves[x_, y_, w_, a_, t_] :=
 Sin[w ((Cos[a] + Sin[a]) x + (Sin[a] - Cos[a]) y) + t*2 Pi]

G[ImgDataG_, ImgDataC_, IS_, s_, N_, w_, A_, A1_, A2_, h_, f_, t_] :=
 Graphics[
  Table[
   Translate[
    {RGBColor[Part[ImgDataC, y, x]/255], Opacity[.6],
     Disk[{x, -y},
          (A1 + A2 (1 - Part[ImgDataG, y, x]/255))*A(1 +
           Sum[waves[x + 200, y + 50, w, a*2 Pi/N, t],
           {a, 0, N - 1, 1}]/(2 N))]},
   h*{Cos[2 Pi*(t + f (x + y)/L)], Sin[2 Pi*(t + f (x + y)/L)]}],
 {x, 1, L, s}, {y, 1, L, s}],
PlotRange -> {{-15, L + 11}, {15, -L - 11}}, ImageSize -> IS]


Manipulate[
 G[hthrG, hthrC, 540, 8, 5, .1, 4, .7, 3, 2, 1.5, t],
{t, 0, 1}]
![maihudson:
“Image data courtesy of Marina Abramovic and Sean Kelly Gallery, NY
Mathematica code:
MA = ImageCrop[Import["marina.jpg"],1300];
MAc = ImageData[MA, "Byte"];
MAg = ImageData[ColorConvert[MA, "GrayLevel"], "Byte"];
waves[x_, y_, w_, a_, t_]...](https://64.media.tumblr.com/a035e6bc8a10824b8d297e854627c8ee/tumblr_np8z0fvoAv1sn5m9vo1_500.gifv)
Image data courtesy of Marina Abramovic and Sean Kelly Gallery, NY
Mathematica code:MA = ImageCrop[Import["marina.jpg"],1300];
MAc = ImageData[MA, "Byte"];
MAg = ImageData[ColorConvert[MA, "GrayLevel"], "Byte"];
waves[x_, y_, w_, a_, t_] :=
Sin[w ((Cos[a] + Sin[a]) x + (Sin[a] - Cos[a]) y) + t*2 Pi]
Manipulate[
Graphics[
Table[
Translate[
{RGBColor[MAc[[y, x]]/255], Opacity[.8],
Disk[{x, -y}, (.7 + 5 (1 - MAg[[y, x]]/255))*3 (1 +
Sum[waves[x, y, .07, a* 2 Pi/5, t], {a, 0, 4, 1}]/(210))]},
3*{Cos[2 Pi*(t + x/1300 + y/1300)],
Sin[2 Pi*(t + x/1300 + y/1300)]}],
{x,1,1300,15}, {y,1,1300,15}],
PlotRange -> {{-15, 1315}, {15, -1315}}, ImageSize -> 500],
{t,0,.95,.05}]
Thank you MAI + t for hosting intothecontinuum!
Animated GIFs (700 x 700)
Mathematica code:Dashboard[z_] := RGBColor[54/255, 70/255, 93/255, z];
BG = Raster[
Table[.005 ((i - 500)^2 + (j - 500)^2),
{i,1000}, {j,1000}],
{Scaled[{0, 0}], Scaled[{1, 1}]}, {1, 1000},
ColorFunction -> Dashboard];
P = {{5, 8, 10}, {4.5, 12, 7}, {3, 16, 10}};
Manipulate[With[{h=P[[k,1]], u=P[[k,2]], s=P[[k,3]]},
Graphics[
Table[
{AbsoluteThickness[h],
RGBColor[54/255, 70/255, 93/255],
Circle[
{s*Cos[i*2 Pi/u], s*Sin[i*2 Pi/u]},
t + (100 - n) (1 + Sign[100 - n])/2]},
{n, 0, 100, 1}, {i, 0, u - 1, 1}],
PlotRange -> {{-16, 16},{-16, 16}}, ImageSize -> 700,
Prolog -> BG]],
{k,1,3,1}, {t, 0, 1}]
Animated GIF (700 x 700)
Mathematica code:vertices =
Table[Table[
RotationTransform[a, {1, 1, 0}, {0, 0, 0}][Tuples[{-1, 1}, 3][[v]]], {v, 1,8, 1}], {a, 0, 2 Pi, Pi/80}]; Edge := {1, 2, 4, 3, 7, 8, 6, 5, 1, 3, 4, 8, 7, 5, 6, 2} CubeTrail[N_, s_, r_, z_, t_] :=
Graphics[
Table[ Scale[
Translate[{AbsoluteThickness[1.5], Opacity[1], White,
Line[
Table[ {vertices[[1 + Mod[t, 80]]][[Edge[[e]]]][[1]],
vertices[[1 + Mod[t, 80]]][[Edge[[e]]]][[2]]}, {e, 1, 16, 1}]]},
r*{Cos[2 Pi*(n*t/80 + k)/N], Sin[2 Pi*(n*t/80 + k)/N]}], z^n, r*{Cos[2 Pi*(n*t/80 + k)/N], Sin[2 Pi*(n*t/80 + k)/N]}], {k, 1, N, 1}, {n, 1, s, 1}], PlotRange -> 5, ImageSize -> 700, Background -> RGBColor[54/255,70/255,93/255]] Manipulate[ CubeTrail[4, 8, 3.8, .75, t], {t, 1, 80, 1}]
Animated GIF (700 x 700)
Mathematica code:F[L_, a_, r_, s_, t_] :=
Table[ {-(r + s*Cos[t])^n*Sin[n*a], (r + s*Cos[t])^n*Cos[n*a]}, {n, 0, L}]; Manipulate[
Graphics[
Table[
Rotate[
Table[
Translate[
Rotate[ {White, Polygon[F[ 160, Pi/2 + (u + k)*2 Pi/5, .975, 0, 0]]},
u*2 Pi, {0, 0}],
3{Cos[(u + k)*2 Pi/5],Sin[(u + k)*2 Pi/5]}],
{k, 0, 4, 1}],
j*Pi/5, {0, 0}], {j, 0, 5, 5}],
PlotRange -> 4, ImageSize -> 700,
Background -> RGBColor[54/255, 70/255, 93/255]], {u, 0, 59/60, 1/60}]
Each animated GIF consists of only 2 frames constructed entirely with straight lines and colored black and white. The second frame results from the first by inverting or interchanging the two colors.
Animated GIFs (700 x 700)
Mathematica code:F[L_, a_, r_, s_, t_] :=
Table[ {-(r + s*Cos[t])^n*Sin[n*a], (r + s*Cos[t])^n*Cos[n*a]}, {n, 0, L}]; P := {{213, 3.2899, 0.997}, {215, 2.7633, 0.996}, {200, 3.3300, 0.996}, {214, 3.2748, 0.997}}; Manipulate[
Graphics[ Polygon[ F[P[[j, 1]], P[[j, 2]], P[[j, 3]], .002, t]],
PlotRange -> 1, ImageSize -> 700], {j, 1, 4, 1}, {t, 0, 2 Pi}]
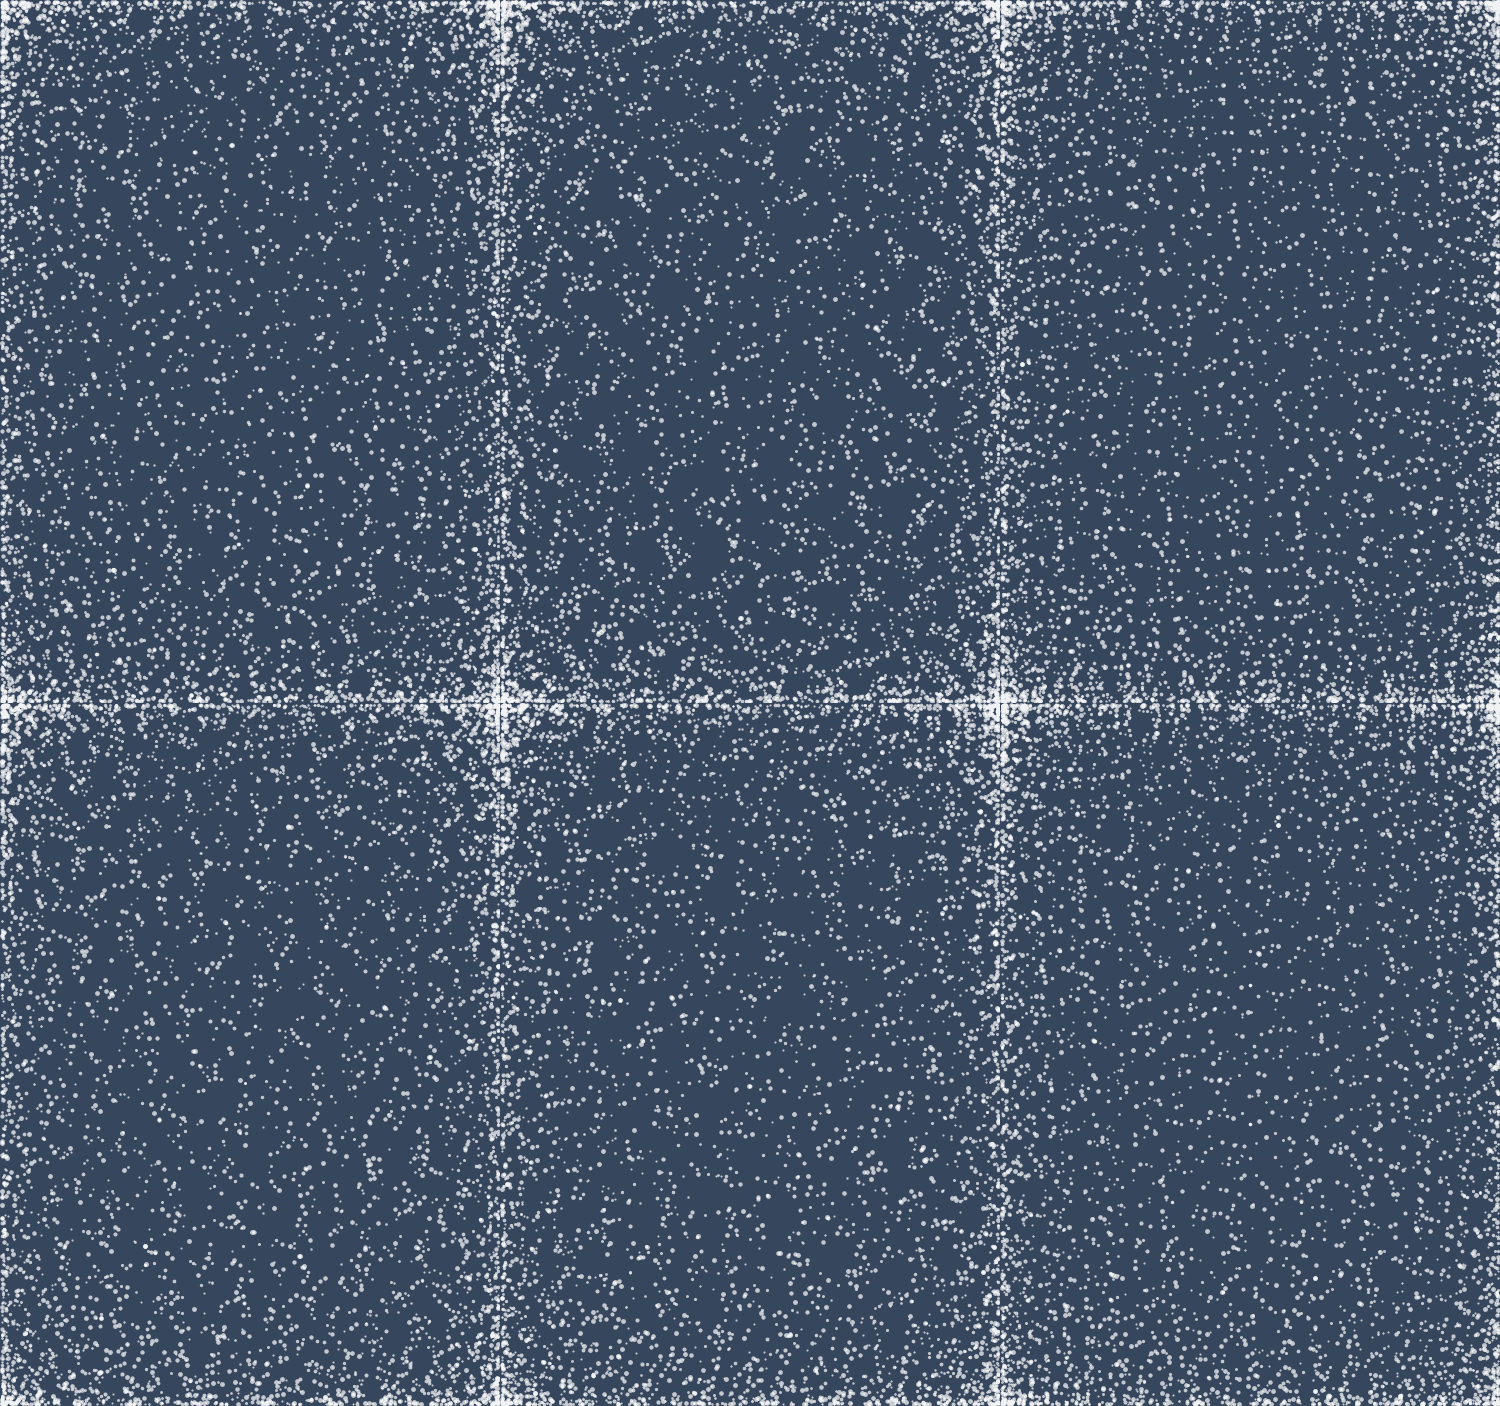
This animated GIF is 20 frames long and takes 2 seconds to repeat itself, but if you pick any point and follow its motion continuously it will take 2000 seconds (about 30 minutes) for the point to return to the same location it was in when you started watching it! How long can you follow a single point?
Mathematica code:
G[p_, q_, a_, b_, c_, t_] :=
 Graphics[
  Table[
   {Opacity[.7], White,
    Disk[
     {.71*Cos[a (.05*t + n)*Pi/500 + p],
      Cos[b (.05*t + n)*Pi/500 + q]},
      .002*Cos[c (.05*t + n)*Pi/500] + .005]},
   {n, 1, 1000}],
  PlotRange -> {{-.715, .715}, {-1.005, 1.005}},
  Background-> RGBColor[54/255,70/255,93/255],
  ImageSize -> 500]

Manipulate[
   Show[
    G[0, .2, 29, 13, 11, t],
    G[0, .2, 19, 31, 9, t],
    G[.3, .29, 3, 23, 17, t],
    G[0, .3, 43, 7, 3, t],
    G[.1, .13, 31, 19, 2, t]],
{t,1,20,1}]
![maihudson:
“Mathematica code:
Manipulate[
Graphics[
Table[
{Thickness[.006], RGBColor[54/255,70/255,93/255],
Circle[{(16 - t)*Cos[i*Pi/2], (16 - t)*Sin[i*Pi/2]}, (100 - n) (1 + Sign[100 - n])/2]},
{n,0,100,1}, {i,0,3,1}],
PlotRange -> {{-40,40},...](https://64.media.tumblr.com/4c23e4885804e0b99c52f2bc8775ffd0/tumblr_nokifmsV7B1sn5m9vo1_500.gifv)
Mathematica code:
Manipulate[
 Graphics[
  Table[
   {Thickness[.006], RGBColor[54/255,70/255,93/255],
    Circle[{(16 - t)*Cos[i*Pi/2], (16 - t)*Sin[i*Pi/2]}, (100 - n) (1 + Sign[100 - n])/2]},
  {n,0,100,1}, {i,0,3,1}],
 PlotRange -> {{-40,40}, 7/5{-40,40}}, ImageSize -> {500,700}],
{t,0,2.6,.2}]
“Rhythm and repetition are at the root of movement. They create a situation within which the most simple, basic forms start to become visually active. By masking them and repeating them they become more fully present. Repetition acts as a sort of amplifier for visual events, which seen singly would hardly be visible, but to make these basic forms release the full visual energy within them they have to breathe as it were – to open and close, or to tighten up and then relax. A rhythm that is alive has to do with changing pace, and feeling how the visual speed can expand and contract, sometimes go slower and sometimes go faster. The whole thing must live.”
These animations are inspired by Bridget Riley’s “Blaze 1” (1962), and were generated using log-polar transformations.Mathematica code:
WfPlot[s_, w_, t_] :=
 Graphics[
  Table[
   {AbsoluteThickness[2],
    Line[
     Table[
      {i + If[Mod[i, 2] == 0, s*Sin[j*2 Pi/w + i*2 Pi/6 + t], 0],
       (-1)^i*.5 + .4*j},
     {i, -2, 15}]]},
   {j, 1, 69, 1}],
  PlotRange -> {{1, 20}, {.8, 27.2}}, ImageSize -> {1000,1000},
  Background -> RGBColor[54/255, 70/255, 93/255]];

LogPolar[x_, y_] := {Log[Sqrt[x^2 + y^2]], ArcTan[x, y]};

p:={{66,.2},{6,.3},{11,.4}}

Manipulate[
 ImageResize[
  ImageTransformation[
   WfPlot[p[[k,1]],p[[k,2]], t],
  LogPolar[#[[1]], #[[2]]] &, DataRange -> {{-Pi, Pi}, {-Pi, Pi}}],
 700],
{k, 1, 3, 1}, {t, 0, 2Pi}]
![maihudson:
“Mathematica code:
S[n_, t_] := Sin[n*3 Pi/50 + t];
Manipulate[
Show[
Table[
Plot[
100 - n + (20*Abs[S[n,t]] + .02)*Exp[-(x - 4*S[n, t])^2/Abs[S[n,t]]],
{x, -10, 10},
PlotStyle -> Directive[White, Thick], PlotRange -> {{-7, 7}, {0,...](https://64.media.tumblr.com/b0d9a41278b03e2c816647b13a4e60bf/tumblr_nof7qcscIo1sn5m9vo1_500.gifv)
Mathematica code:
S[n_, t_] := Sin[n*3 Pi/50 + t];

Manipulate[
 Show[
   Table[
    Plot[
     100 - n + (20*Abs[S[n,t]] + .02)*Exp[-(x - 4*S[n, t])^2/Abs[S[n,t]]],
     {x, -10, 10},
    PlotStyle -> Directive[White, Thick], PlotRange -> {{-7, 7}, {0, 100}},
    Filling -> Axis, FillingStyle -> White, Axes -> False, AspectRatio -> Full,
    ImageSize -> {500, 750}, Background -> RGBColor[54/255, 70/255, 93/255]],
  {n, 1, 100, 1}]],
{t, .001, 2 Pi + .001, (2 Pi + .001)/30}]
Algorithmically generated using circles subjected to constrained randomness
Animated GIFs (600x600)
Mathematica code:
RR[n_, m_] := (SeedRandom[n*m]; RandomReal[])

L[t_, Q_, g_, i_] := Sum[ Exp[-(t - (RR[i, 5*Q] + j))^2/g], {j, {-1, 0, 1}}]

G[c_, F_, P_, s_, o_, g_, A_, a_, w_, t_, r_, Q_, pr_, is_] :=
 Graphics[
  Table[
   Table[
    {RGBColor[RR[i, Q], RR[i, 2*Q], RR[i, 3*Q], o + A*L[t, 5*Q, g, i]],
     Disk[
      RotationTransform[(k + (-1)^(i*w)*t*a)*2 Pi/F]
       [{r*RR[2 i, 4*Q], r*RR[2 i + 1, 4*Q]}], s*L[t, 5*Q, g, i]]},
   {k, 0, F - 1, 1}],
  {i, 1, P, 1}],
 PlotRange -> pr, ImageSize -> is,  Background -> c]


Manipulate[[
   G[RGBColor[54/255, 70/255, 93/255], 12, 50, .2, 0, .1, .25, 1, 1, t, 1, Q, 1.6, 600],
  {Q, {41, 72, 1, 76}}, {t, 0, .96, .04}],
![Mathematica code:
hthr = Import["hthrtzy.jpg"];
hthrC = ImageData[hthr, "Byte"];
hthrG = ImageData[ColorConvert[hthr, "GrayLevel"], "Byte"];
L = Length@hthrC;
waves[x_, y_, w_, a_, t_] :=
Sin[w ((Cos[a] + Sin[a]) x + (Sin[a] - Cos[a]) y) + t*2...](https://64.media.tumblr.com/0e10327686171b2772590c788c980e12/tumblr_nqffnpsNNO1qfjvexo1_540.gifv)
![maihudson:
“Animated GIF (700 x 700)
Mathematica code:
vertices =
Table[Table[
RotationTransform[a, {1, 1, 0}, {0, 0, 0}][Tuples[{-1, 1}, 3][[v]]], {v, 1,8, 1}], {a, 0, 2 Pi, Pi/80}]; Edge := {1, 2, 4, 3, 7, 8, 6, 5, 1, 3, 4, 8, 7, 5, 6, 2}...](https://64.media.tumblr.com/d80320fde6e6954562afa1760741a75e/tumblr_noxbi2xFHk1sn5m9vo1_1280.gifv)
![maihudson:
“Animated GIF (700 x 700)
Mathematica code:
F[L_, a_, r_, s_, t_] :=
Table[ {-(r + s*Cos[t])^n*Sin[n*a], (r + s*Cos[t])^n*Cos[n*a]}, {n, 0, L}]; Manipulate[
Graphics[
Table[
Rotate[
Table[
Translate[
Rotate[ {White, Polygon[F[ 160, Pi/2 +...](https://64.media.tumblr.com/78c04bd1fdeba5ff08ea730ea60b902f/tumblr_nou87fTfbk1sn5m9vo1_1280.gifv)