Postmortem: RDS Clogs & Cache-Refresh Crash Loops
By Rachel Fong | Last modified on January 11, 2019
- On Thursday, October 4, we experienced a partial API outage from 21:02 to 21:56 UTC (14:02 to 14:56 PDT).
- Despite some remediation work, we saw a similar (though less serious) incident again on Thursday October 11 from 15:00 to 16:02 UTC (8:00 to 9:02PDT).
- To implement a more permanent fix, we scheduled an emergency maintenance window which completely interrupted service on Friday Oct 12 for approximately two minutes, from 4:38 to 4:40 UTC (Thursday Oct 11, 21:38 to 21:40 PDT).
Production reliability is incredibly important to us — and we take any incident that causes us to drop or delay customer events extremely seriously. We apologize for any trouble it may have caused our customers. We’d like to tell you what happened and what we've done to prevent these problems from recurring.
Analysis
During the incidents, RDS was stalled at ~90% CPU utilization.
We dug up several conveniently timed minor events, each of which may have contributed a little to tipping over our RDS instance, but was not telling the whole story:
- the beginning of the outage corresponded nearly exactly with a SQL surgery
- this was nearly concurrent with a deploy containing a (fairly simple) production database migration
- one user had recently pathologically created ~5000 teams
The real risk factor was that our production RDS instance's CPU utilization had been idling around a baseline of 30-40% for some time. In addition, utilization regularly spiked up to 50-60% every 10 minutes, which we noticed corresponded exactly with a periodic cronjob we run that tracks disk usage statistics per dataset.
On top of that, by inspecting prod data in our Honeycomb dogfood environment, we discovered that during the same timeframe that RDS was unresponsive, our API servers were repeatedly running out of memory and appeared to be trapped in a crash loop.
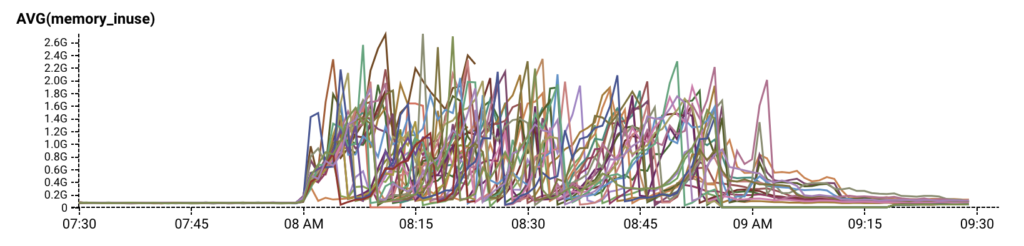
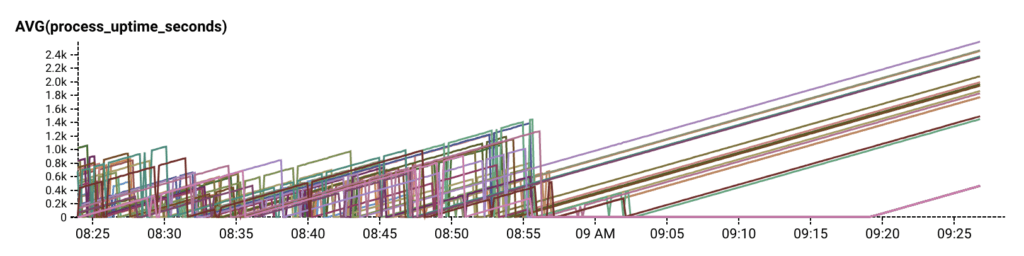
Our quick temporary fix to recover from the crash loop was to temporarily reduce the size of our autoscaling group, relieving the pressure of request retries just enough for RDS and our API servers to self recover. Then we looked for the actual cause.
OOM fix: cache refresh behavior
Previously, when a cache entry expired, it was assumed to be gone from the cache, and any subsequent requests for it would return “not found”. The caller would then typically do a DB query and put the result back into the cache with the correct TTL.
If RDS slowed down a little more than usual (but not pathologically so), cache entries would expire and more goroutines than usual would attempt to refresh the cache. This created a feedback loop where even more goroutines would attempt to refresh the cache. If the slowdown was timed just right on top of one of our periodic 50-60% utilization spikes, it was enough to tip us over.
Once enough cache requests failed, our servers started crashing because of too many requests, causing them to restart, clear their caches, and try to hit the database over and over again. This prevented RDS from recovering and was probably one of the biggest contributors to our OOM problem.
The fix is to change the cache behavior such that only a single goroutine at a time is refreshing the cache. All others get the previously cached value. When the single goroutine finishes its work, it stores the new value into the cache, and subsequent cache lookups retrieve that value. This fixes the thundering herd of cache refreshes that happens after RDS falls behind.
(This is actually something that happens even during normal operation whenever a TTL expires a cache entry, with multiple handlers getting cache misses and hitting the DB. It's just that the number of them is usually small, and the speed at which RDS responds is usually quick.)
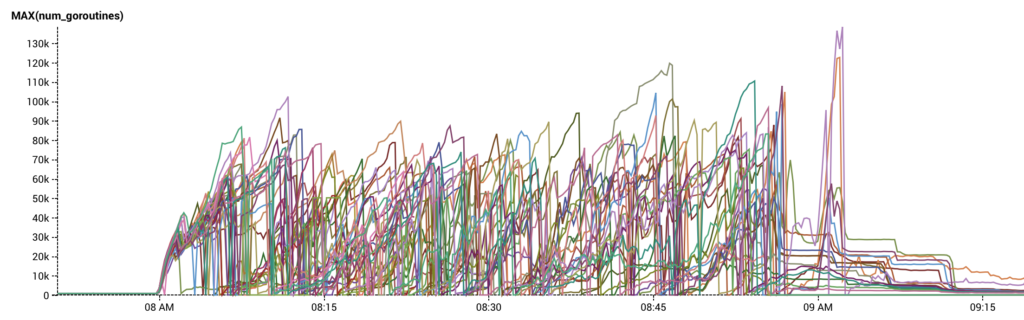
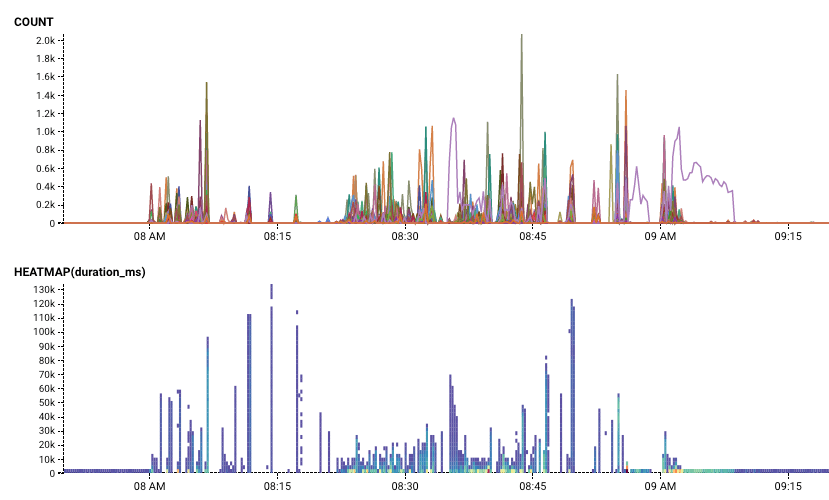
Below, the count and duration of requests in flight during the 10/11 incident (8:00-9:02 PDT). During normal operation, the number of concurrent requests in flight per query is 1-3. During the partial outage, we see spikes in the thousands.
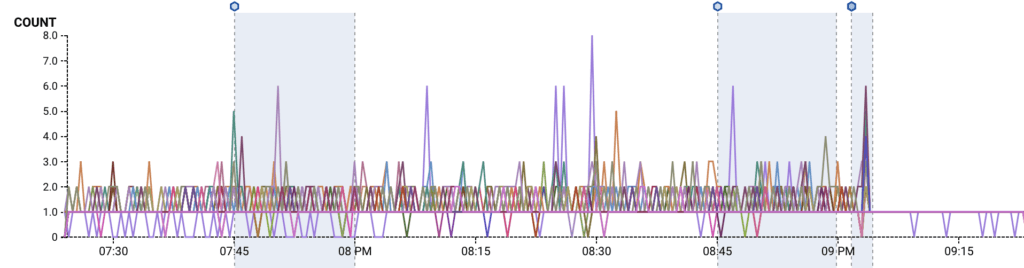
After the cache refresh fixes, we see that the number of queries in flight to refresh bounce information (rate limit, sampling, blacklist) drops; we only ever do a single query at a time now.
Although the cache fix addresses an immediate culprit, we knew we would continue to be at risk of a single DB-intensive incident tipping over our RDS instance in the future unless we reduced our baseline utilization.
Longer term followups
For one thing, we had simply reached a usage volume where we benefited more from throwing money than engineer-hours at this particular database problem. We scheduled a brief emergency maintenance window about 12 hours after the 10/11 outage to upgrade our production RDS instance from m4.xlarge to m5.2xlarge, which briefly interrupted all services for a few minutes but reduced our idling utilization percentage from 30-40% to 6%. It also had the bonus effect of reducing and dramatically stabilizing query times.
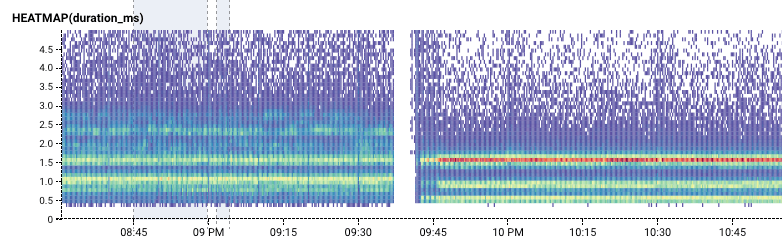
The 2-minute gap is the interruption of our service during the scheduled upgrade. The higher-contrast lines after the gap signify that query times are significantly more consistent.
Other action items
- We used our internal Honeycomb instance to inspect the latency of our highest volume RDS queries, and identified cases where we could stand to reduce their frequency.
- We considered slowing down or staggering the disk-usage-gathering cronjob that had been periodically causing our RDS utilization to spike 20%, so that it wouldn't hammer the database so much as soon as it started running.
- We dug into that periodic cronjob more and noticed we were unnecessarily running it on all datasets, so we stopped running it on relatively stale datasets, yielding a ~25% reduction in that cronjob's DB writes.
Observability is as much as factor of culture as code, and we also documented miscellaneous stumbling points and on-call processes that had caused confusion or burned time during the outage. Getting to dogfood an outage at Honeycomb is such a rare delight and a worthy test of our platform's capabilities that everyone jumps on board whenever an incident alert goes off. We always learn new lessons during an outage, and add new event context so that we can better understand the behavior of our systems in the future.
Thanks for your patience during this outage.
Related Posts
Real User Monitoring With a Splash of OpenTelemetry
You're probably familiar with the concept of real user monitoring (RUM) and how it's used to monitor websites or mobile applications. If not, here's the...
Transforming to an Engineering Culture of Curiosity With a Modern Observability 2.0 Solution
Relying on their traditional observability 1.0 tool, Pax8 faced hurdles in fostering a culture of ownership and curiosity due to user-based pricing limitations and an...
Honeycomb + Google Gemini
Today at Google Next, Charity Majors demonstrated how to use Honeycomb to find unexpected problems in our generative AI integration. Software components that integrate with...