
This article describes an issue caused by a Linux container image running on a “mismatched” Linux kernel version. The exploration starts from a high level understanding of the problem, and continues with some more detailed troubleshooting using different advanced visibility tools to study the nature of the misbehavior. The troubleshooting goes through system calls, page faults and libc analysis, until the specific issue is identified as a vsyscall/vDSO incompatibility between kernel and userspace. Finally, a few considerations about the performance impact of running such mismatched containers are made.
Introduction
In previous articles, I talked at length about the isolation benefits of adopting containers. While certainly being one major feature, isolation is not the only reason why containers became mainstream over the past few years. As applications evolved to be more modular and complex to build and deploy, containers enabled the principle of build once, run everywhere, in the sense that a container image can be treated as an extremely portable executable artifact that can run an arbitrary complicated application on any Linux system where the container runtime is installed. Both developers and infrastructure operators know very well how easy and efficient this workflow is, as opposed to packaging software in traditional tarball/dpkg/rpm packages and having to manually handle even the slightest difference in init scripts and such across different distributions (e.g. development laptop, production servers, ad-hoc customer deployments, …).
However, this portability concept must not be abused, since in rare circumstances it can create some problems, as I’ll show in the next sections. In Container isolation gone wrong I described an issue caused by running containers on a platform powered by an older Linux kernel. In that specific case, the lack of some features in the aged kernel resulted in some non-obvious performance quirks for applications running in containers. Today I will show how the opposite is just as dangerous, by presenting a real life use case that I stumbled upon a few months ago, where running a container based on a container image much older than the hosting platform and kernel caused some trouble as well.
The problem: a container mysteriously fails to start
Our commercial monitoring product, Sysdig Monitor, can be used by our customers as a SaaS by simply logging into a web application hosted by us, or it can be deployed as on-premises software behind your firewall, for customers who prefer to do so. The application is made of different moving components that can be individually scaled to fit the needs of each workload, so one of the ways we decided to ship this to end users is via a few container images that can be orchestrated with some simple Kubernetes manifests.
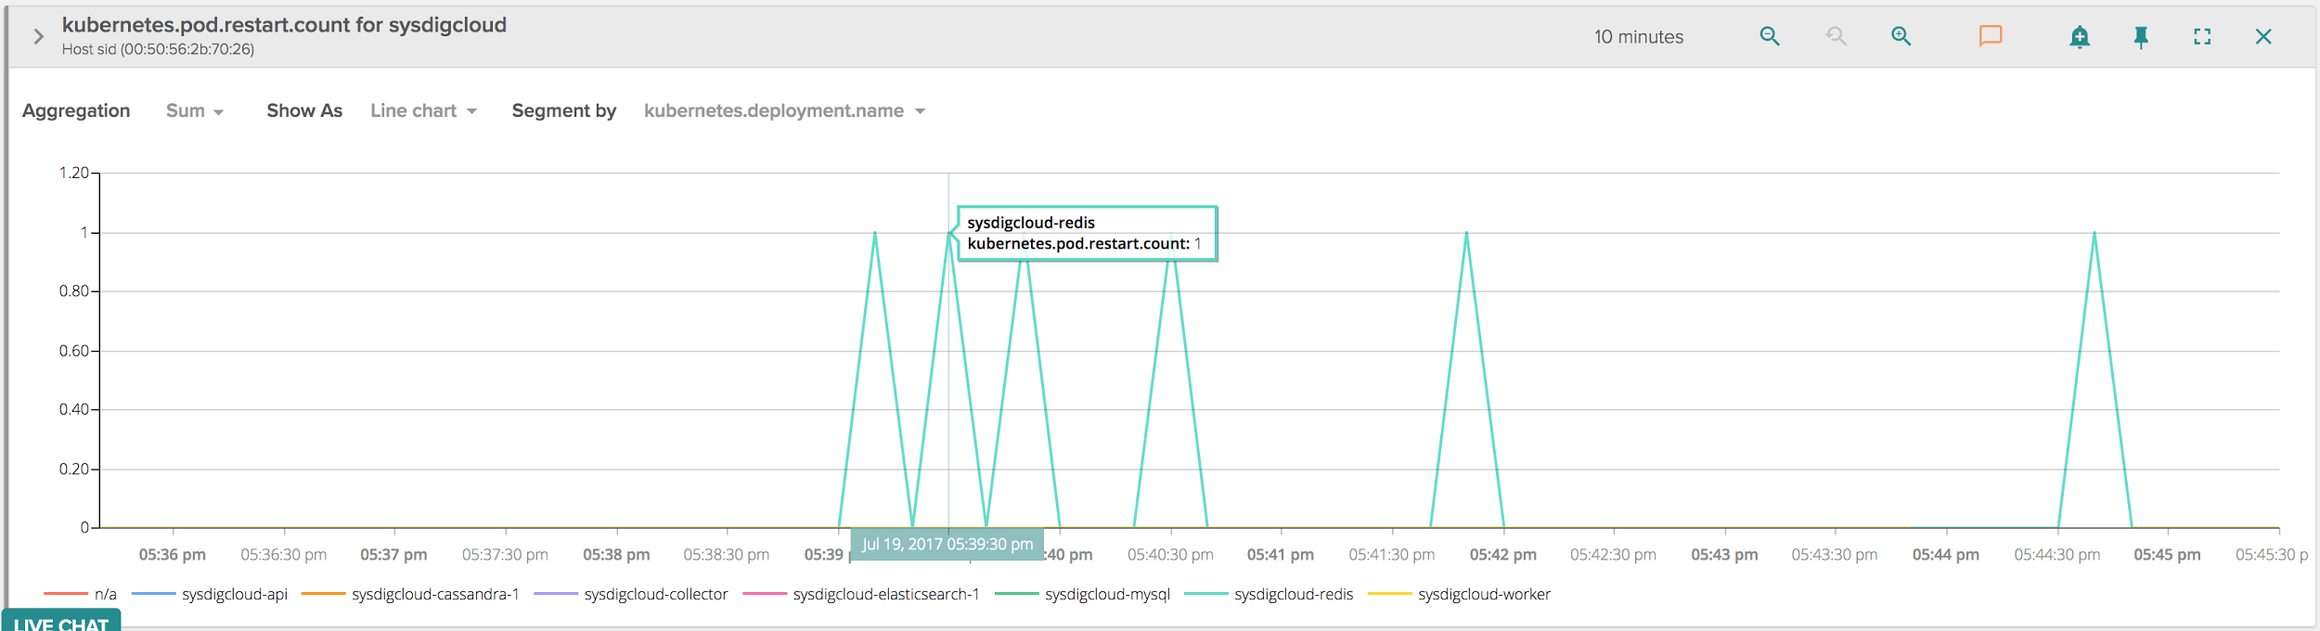
A few months ago, one customer came to us saying they couldn’t bootstrap our application on Kubernetes since one container, the one running our Redis instance, was refusing to start and there wasn’t anything obvious in the logs that would point to a trivial failure. Since we tend to do a lot of smoke testing for different target platforms before releasing, I was surprised about having a customer suffer a problem as severe as a container not starting. We asked more information about the specific configuration of the host (distribution and kernel version), and I then replicated the scenario myself. Indeed, starting our application, I could see that Kubernetes was constantly restarting the Redis containers, with an exponential backoff delay:
Also, from the Kubernetes API I couldn’t see any log coming from the Redis container pointing to a failure. From Sysdig Monitor I could also dig down into what specific processes were running into the containers before the crash:
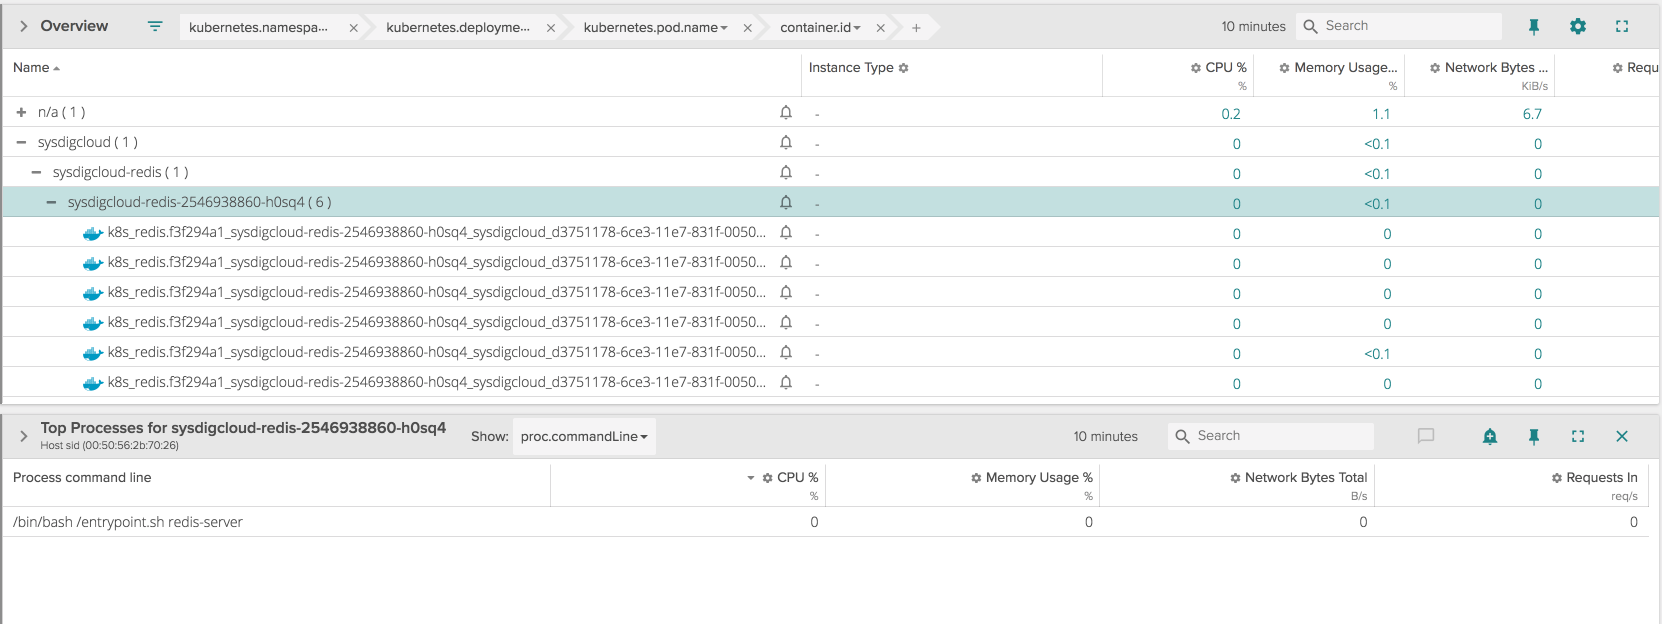
From the tables above, over a period of 10 minutes the Redis container was restarted about 6 times, and for each of those containers the application didn’t seem to make it past the initial bash script that works as an entry point, so Redis didn’t even come into play.
Considering that the full application, including the Redis container, was working just fine on any other platform we did our testing on, this problem urged the need for some non-trivial troubleshooting, and the best thing to do was creating a Sysdig trace file right from the Sysdig Monitor tool for a period of time long enough to catch one of those restarts, and then try to analyze it.
To make things worse, we were pretty much using an off the shelf image of a battle tested version of Redis (redis:2.8.22 from the DockerHub), so this was essentially pristine upstream.
Troubleshooting a crashing container
The trace file obtained at the previous step contains all the system activity generated by the host during the captured interval, most importantly system calls and other rather significant events such as page faults and scheduler context switches. Hopefully by analyzing the activity of the container upon start I can get some clue about this mysterious and silent failure. Let’s try using a simple filter to limit the events to the ones generated by the Redis container:
$ sysdig -r trace.scap container.image contains redis
...
117344 00:54:05.133315899 3 entrypoint.sh (68255) < execve res=0 exe=/bin/bash args=/entrypoint.sh.redis-server. tid=68255(entrypoint.sh) pid=68255(entrypoint.sh) ptid=68239(docker-containe) ...
...
117838 00:54:05.134815863 3 entrypoint.sh (68255) > open
117839 00:54:05.134830357 3 entrypoint.sh (68255) < open fd=3(<f>/lib/x86_64-linux-gnu/libc.so.6) name=/lib/x86_64-linux-gnu/libc.so.6 flags=1(O_RDONLY) mode=0
117860 00:54:05.134992114 3 entrypoint.sh (68255) > mmap addr=0 length=3713080 prot=5(PROT_READ|PROT_EXEC) flags=1026(MAP_PRIVATE|MAP_DENYWRITE) fd=3(<f>/lib/x86_64-linux-gnu/libc.so.6) offset=0
117861 00:54:05.134993418 3 entrypoint.sh (68255) < mmap res=7F66C3F3D000 vm_size=9192 vm_rss=360 vm_swap=0
...
119580 00:54:05.138489812 3 entrypoint.sh (68255) > getuid
119581 00:54:05.138490497 3 entrypoint.sh (68255) < getuid uid=0(root)
119592 00:54:05.138511216 3 entrypoint.sh (68255) > getgid
119593 00:54:05.138511523 3 entrypoint.sh (68255) < getgid gid=0(root)
119596 00:54:05.138512547 3 entrypoint.sh (68255) > geteuid
119597 00:54:05.138512742 3 entrypoint.sh (68255) < geteuid euid=0(root)
119598 00:54:05.138513647 3 entrypoint.sh (68255) > getegid
119599 00:54:05.138513930 3 entrypoint.sh (68255) < getegid egid=0(root)
119648 00:54:05.138621192 3 entrypoint.sh (68255) > rt_sigprocmask
119649 00:54:05.138621497 3 entrypoint.sh (68255) < rt_sigprocmask
119660 00:54:05.138648915 3 entrypoint.sh (68255) > page_fault addr=FFFFFFFFFF600400 ip=FFFFFFFFFF600400 error=154(PAGE_NOT_PRESENT|READ_ACCESS|USER_FAULT|INSTRUCTION_FETCH)
119663 00:54:05.138658252 3 entrypoint.sh (68255) > signaldeliver spid=0 dpid=68255(entrypoint.sh) sig=11(SIGSEGV)
119702 00:54:05.138784117 3 entrypoint.sh (68255) > procexit status=11
This output contains a lot of interesting information that can help us understand a bit better what went on under the hood. The trace file starts with an execve(), indicating that the container is executing /bin/bash /entrypoint.sh redis-server, in other words the container entry point. This is consistent with what Sysdig Monitor showed, and up until this point there’s no Redis involved.
bash, like pretty much any other process in Linux, starts its execution by opening a few system libraries, such as libc, and mapping them into its own memory address space. This will allow bash to use at runtime all the important functions exported by those libraries. Then, it asks for the uid/gid/euid credentials for the process, meaning that we are still very early on in the initialization phase (as the timestamps of the events confirm). Exactly during this initialization phase though, at some point the kernel delivers to the process the fatal signal SIGSEGV (signaldeliver event), meaning that an illegal memory access has been attempted by the application. In turn, bash, which doesn’t catch the SIGSEGV signal, just exits with status 11, and this explains how all those Redis container instances are dying.
Why does bash try to do an illegal memory access, especially during early process initialization, which should just be standard boilerplate code? Sysdig tells us one more bit of information: right before the SIGSEGV event, a page_fault_user event for the memory address 0xffffffffff600400 was generated and, since we don’t see any activity after that, it’s safe to assume that this page fault was the one causing the segmentation fault.
Understanding page faults
Before continuing, what is a page fault? In a traditional architecture, whenever a process tries to access some memory address that is not currently resident into its address space, the CPU will generate an exception, called page fault, that will cause the process execution to halt and some kernel code, the page fault handler, will run in order to try to remedy the situation. In the page fault handler, two things can happen: if the process is allowed to access that memory address but the memory page is simply not loaded in memory, the kernel will, for example, load the memory content from disk and, once finished, resume the process as if nothing ever happened. If, instead, the memory address is outside the memory areas allowed by the process and thus illegal, the kernel will typically terminate the process, by sending it a SIGSEGV signal. One typical example of this last behavior is the very popular fatal access to the NULL (0x0) address, which causes a segmentation fault error that terminates the process.
Judging from the SIGSEGV event right after the page fault one and the PAGE_NOT_PRESENT flag, we can easily guess that the bash process fell into the second case, the illegal access. To double check that the 0xffffffffff600400 address is actually not mapped into the process space, we can parse the output of the various mmap() system calls from Sysdig and check if a memory range (return value of the mmap() call) matches the address. Alternatively, if the process is long lived enough (not this case), we can also use the output of /proc/PID/maps, which would show all the process memory areas in an output similar to this:
gianluca@faulty_host:~$ cat /proc/self/maps
65cee0d000-65cee15000 r-xp 00000000 08:01 1179878                        /bin/cat
...
65cf663000-65cf684000 rw-p 00000000 00:00 0                              [heap]
7ff9902e6000-7ff99047b000 r-xp 00000000 08:01 786716                     /lib/x86_64-linux-gnu/libc-2.24.so
...
7ffd268c7000-7ffd268e8000 rw-p 00000000 00:00 0                          [stack]
7ffd2693b000-7ffd2693d000 r--p 00000000 00:00 0                          [vvar]
7ffd2693d000-7ffd2693f000 r-xp 00000000 00:00 0                          [vdso]
Even if this is not the exact output since I’m printing the mappings of another process (cat), it’s easy to notice that typically all the addresses mapped in the memory of a process have “reasonable values”, none of them goes as high as 0xffffffffff600400: this one is at the very end of the 64 bit address space, hinting at something suspicious. Perhaps my container image has been somehow compromised and something malicious is going on? That still wouldn’t explain why it works just fine on virtually any other host I run it.
Before gathering additional data, there’s another piece of information we can grasp from the Sysdig output: in the page fault event, the instruction pointer value at the time of the fault (ip parameter), which indicates precisely on which part of the code the process was stopped at the time of the fault, has the same 0xffffffffff600400 value of the illegal memory access itself. This means that the bash process not only tried to read from that specific memory address, but it was actually trying to execute some instruction, likely a function, at that address. This is also confirmed by the INSTRUCTION_FETCH flag that sysdig decoded for the fault event. One more interesting clue about what happened. In search of 0xffffffffff600400: #troubleshooting #containers through system calls Click to tweet
More troubleshooting: inside the container
Now that I was able to establish more context about this problem, I can go in interactive mode and try to figure out what piece of code inside bash caused this page fault. Since the issue seems to be happening with bash, let’s see if I can manually run the Redis container specifying as an entry point another shell, for example /bin/sh:
gianluca@faulty_host:~$ docker run -it --rm --entrypoint /bin/sh redis:2.8.22
#
It worked. What if I execute bash right now?
# bash
Segmentation fault
#
I get the crash behavior, as expected. At this point, I can quickly install gdb inside the container and verify which part of the bash code is actually causing the issue to happen:
# apt-get update
E: Method http has died unexpectedly!
E: Sub-process http received a segmentation fault.
#
Core dump troubleshooting inside Docker container
Unfortunately, also apt-get crashes, presumably for the same reason, so there doesn’t seem to be an easy way to install additional packages inside the container. I could in theory run gdb from outside the container (in the host) and attach it to the bash process running inside the container however, the amount of trickery I’d have to play to just correctly point gdb to the right version of the system libraries inside the container seems daunting, so I’m going to opt for the strategy of creating a core dump of the bash process while it’s crashing and then exploring it with gdb on the same container running in another host that’s not making the container crash, since, as said previously, the issue seems to be isolated to this very specific customer distribution:
# ulimit -c unlimited
# bash
Segmentation fault (core dumped)
#
Once I have the core dump, I can move to the other host and run gdb inside the same container image:
gianluca@working_host:~$ docker run -it --rm redis:2.8.22 bash
...
root@09fb5ac2c347:~# gdb /bin/bash core
Core was generated by `bash'.
Program terminated with signal 11, Segmentation fault.
#0 0xffffffffff600400 in ?? ()
(gdb) bt
#0 0xffffffffff600400 in ?? ()
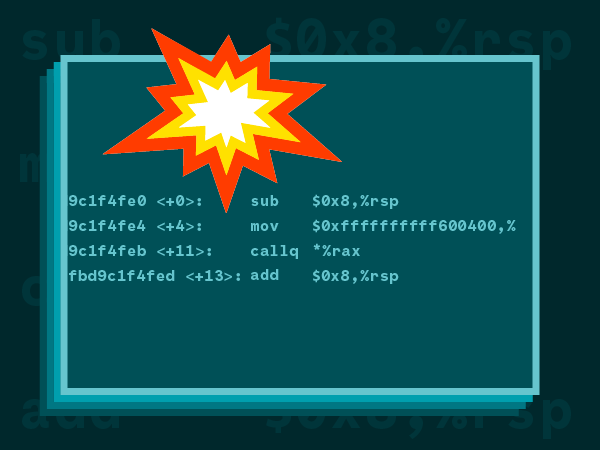
#1 0x00007fbd9c1f4fed in time () at ../sysdeps/unix/sysv/linux/x86_64/time.S:36
#2 0x0000000000420324 in main ()
This shows the stack trace that caused the illegal memory access, and surprisingly the crash happened during a time() call (frame #1), a popular system call that returns the current timestamp of the system. At some point during the invocation of time(), libc decided to call a function at address 0xffffffffff600400 (frame #0), which is precisely what caused the page fault and then the crash. Let’s ask gdb to take a look at the actual assembly that caused the illegal call:
(gdb) f 1
#1  0x00007fbd9c1f4fed in time () at ../sysdeps/unix/sysv/linux/x86_64/time.S:36
36      in ../sysdeps/unix/sysv/linux/x86_64/time.S
(gdb) disas
Dump of assembler code for function time:
   0x00007fbd9c1f4fe0 <+0>:     sub    $0x8,%rsp
   0x00007fbd9c1f4fe4 <+4>:     mov    $0xffffffffff600400,%rax
   0x00007fbd9c1f4feb <+11>:    callq  *%rax
=> 0x00007fbd9c1f4fed <+13>:    add    $0x8,%rsp
   0x00007fbd9c1f4ff1 <+17>:    retq
End of assembler dump.
(gdb)
Assembly can be a bit tedious to read, but this one is actually pretty easy, we can identify two key instructions:
- libc initializes the rax CPU register to the value 0xffffffffff600400 with a mov instruction.
- libc calls the function at the rax register address with the callq instruction, effectively executing code at address 0xffffffffff600400.
- The callq instruction will cause the page fault and the crash.
It’s interesting to notice that this is not what a normal system call invocation looks like. Let’s compare what happens when we invoke a traditional system call, for example by intercepting an open() system call while we execute /bin/ls:
gianluca@sid:~$ gdb /bin/ls
...
(gdb) catch syscall open
Catchpoint 1 (syscall 'open' [2])
(gdb) r
Starting program: /bin/ls
Catchpoint 1 (call to syscall open), 0x00007ffff7df2547 in open64 () at ../sysdeps/unix/syscall-template.S:84
84      ../sysdeps/unix/syscall-template.S: No such file or directory.
(gdb) disas
Dump of assembler code for function open64:
   0x00007ffff7df2540 <+0>:     mov    $0x2,%eax
   0x00007ffff7df2545 <+5>:     syscall
=> 0x00007ffff7df2547 <+7>:     cmp    $0xfffffffffffff001,%rax
   0x00007ffff7df254d <+13>:    jae    0x7ffff7df2550 <open64+16>
...
Here is what happens this time:
- libc writes into the eax CPU register the system call number, which in the case of open() is 2 (0x2).
- libc asks the kernel to execute it using the syscall instruction.
This looks much more normal and is the standard protocol used in modern architectures to ask the kernel to execute a system call on behalf of a userspace process. So why did the time() invocation follow a different execution flow, which ultimately caused the illegal memory access and then the crash? To find the answer, we have to poke into the libc’s sysdeps/unix/sysv/linux/x86_64/time.S source code as pointed by gdb, using the version installed inside the Redis container (2.13). Here’s a snippet of it (full version here):
/* For the calculation see asm/vsyscall.h.  */
#define VSYSCALL_ADDR_vtime    0xffffffffff600400
ENTRY (time)
    /* Align stack.  */
    sub $0x8, %rsp
    cfi_adjust_cfa_offset(8)
    movq    $VSYSCALL_ADDR_vtime, %rax
    callq   *%rax
    add $0x8, %rsp
    cfi_adjust_cfa_offset(-8)
    ret
PSEUDO_END_NOERRNO(time)
In the source code, we can clearly see the two same mov/callq instructions that gdb showed us in the core dump, and we can also see how the mysterious 0xffffffffff600400 address is actually hardcoded inside the libc source code itself, under the macro VSYSCALL_ADDR_vtime. This gives us enough clues to go research what the term vsyscall means.
Understanding vsyscall
It turns out the vsyscall mechanism is an optimization relic of the past. In particular, invoking a system call following the traditional protocol with the syscall instruction (and other older invocation mechanisms such as the once popular int 0x80) is typically much slower than a normal function call invocation, since that instruction effectively causes a costly crossing from user to kernel space, so the kernel developers decided at some point to provide a fast path for a few of the most frequently used system calls, such as time().
The way it works is that the kernel maps in every userspace process a single memory page (the vsyscall page) in the address range 0xffffffffff600000 – 0xffffffffff601000 (one page, 4KB) that contains the code for a few very simple and popular system calls that can get called at a very high frequency directly from user space (time(), gettimeofday() and getcpu()). This way, executing those calls by running their code from this memory page is very efficient since the process doesn’t switch in kernel mode and, as we’ll see later, this makes a huge impact on performance.
How does each process know of this trick in order to take advantage of it? Since the vsyscall page address is fixed, there’s simply an ABI convention between the kernel and libc, and libc will hardcode the addresses of those accelerated system calls and will make sure to invoke them by directly executing instructions at the vsyscall page instead of going with the syscall instruction, like we’ve seen earlier.
vDSO vs vsyscall
However, over the years this approach turned out to be very fragile, as putting native machine instructions at fixed memory locations in every process is a security risk that can be exploitable with several techniques (such as Sigreturn-oriented programming), so the Linux kernel came up with the evolution of the vsyscall interface, called vDSO: there are some significant differences between vsyscall and vDSO, but for the scope of this discussion the vDSO can be effectively thought as an implementation of the vsyscall interface that is not placed at a fixed location in the address space of a process, and the kernel randomly chooses a new location for it every time a process runs: this massively mitigates the security flaws of the original vsyscall page.
It’s possible to see the vDSO injected in every Linux process and verify the randomized address by repeatedly looking at the mapped memory regions for different processes:
gianluca@working_host:~$ sudo cat /proc/self/maps | grep "vdso|vsyscall"
7fffa7f25000-7fffa7f27000 r-xp 00000000 00:00 0                          [vdso]
ffffffffff600000-ffffffffff601000 r-xp 00000000 00:00 0                  [vsyscall]
gianluca@sid:~$ sudo cat /proc/self/maps | grep "vdso|vsyscall"
7ffc1a152000-7ffc1a154000 r-xp 00000000 00:00 0                          [vdso]
ffffffffff600000-ffffffffff601000 r-xp 00000000 00:00 0                  [vsyscall]
gianluca@sid:~$ sudo cat /proc/self/maps | grep "vdso|vsyscall"
7ffe9b74e000-7ffe9b750000 r-xp 00000000 00:00 0                          [vdso]
ffffffffff600000-ffffffffff601000 r-xp 00000000 00:00 0                  [vsyscall]
Notice how the vDSO location is always changing, whereas the vsyscall page stays fixed (unlike the previous example, the vsyscall range now shows up because I executed the command from a host that didn’t replicate the container crash).
Over the years, the libc adapted to the kernel changes and started leveraging the vDSO when available, using the older vsyscall mechanism just as a fallback. As time passed and programs started adopting newer libc versions with proper vDSO support, the kernel started discouraging and penalizing more obsolete programs still using the vsyscall interface, and starting from kernel 3.1 the old vsyscall implementation was rewritten in a way that would provide three more secure behaviors, chosen at boot time and compile time:
Native vsyscall mode: in this mode, the vsyscall page contains native machine code that just calls the respective time()/getcpu()/… system calls and can be directly executed from a process. This is the most dangerous setting that most Linux distributions don’t use, since it’s too easily exploitable.
Emulated vsyscall mode: in this mode, access to the vsyscall page will cause a page fault that moves the processor in kernel mode, which will execute the page fault handler and then emulate the system call on behalf of the process, rather than letting it execute native machine code from the vsyscall page itself. This is more secure than the native mode since the vsyscall page is in fact non executable, and it is what most Linux distributions use by default these days.
None vsyscall mode: in this mode, any access to the vsyscall page is rejected by the kernel and the calling process is sent a SIGSEGV signal. This is the most secure mode, and effectively assumes that every process in userspace will use vDSO for fast system call invocation as opposed to the vsyscall, otherwise it will break.
As you can probably guess by now, the Redis container crashed because of two reasons. First, the customer was running on a host where the kernel was configured by default to be in none vsyscall mode, and this is a choice that more distributions are adopting by default, for example Debian.
Second, the Redis container we used from the DockerHub is actually based on the old Debian Wheezy container image, which ships an older libc version that doesn’t try to use the vDSO by default for the time() system call, as we have seen from the gdb instructions. The libc started adopting the vDSO for time() in a later version.
In this case then, decoupling the kernel and libc by running the userspace application from a container based on a much older runtime, caused all sort of issues, and the build once, run everywhere principle didn’t quite work.
By reading the kernel code, I also found out that, if the sysctl entry debug.exception-trace is set (which was not set on our customer’s host), the kernel will also generate a more friendly warning in the kernel log whenever a process is killed because of a vsyscall invocation:
[ 45.846070] bash[6767] vsyscall attempted with vsyscall=none ip:ffffffffff600400 cs:33 sp:7ffd81c0d5a8 ax:ffffffffff600400 si:59714191 di:0
Naturally, on all the other hosts where we tested our application, the kernel was configured in emulated vsyscall mode, so the issue didn’t manifest itself as a crash. However, as I’ll show in the next section, not being aware of these core system behaviors can have unexpected consequences also when it comes to performance.
vsyscall performance implications
It is quite interesting to compare what is the actual impact, from the performance point of view, of executing those accelerated system calls in different vsyscall/vDSO combinations. For this test, I’m going to use a stress program:
This code does a series of time() invocations in a loop, measuring the throughput. The tests were run on a standard Ubuntu 17.04 distribution, a modern one and commonly used in containerized environments.
vDSO
In this case, I’m compiling and running the stress test outside the container, so this will pick the host’s libc, which is recent enough to always prefer vDSO when available:
[ubuntu@ip-10-1-1-103 ~]$ ./stress
266.77M evt/s
The throughput for this test is massive, each time() invocation takes just a few nanoseconds, so this is a clear sign that there’s no switch to kernel mode, and the time() call is implemented just by executing native machine code from the vDSO page, and this is exactly how every application should work these days. I can confirm this behavior with Sysdig:
[ubuntu@ip-10-1-1-103 ~]$ sudo sysdig proc.name=stress
...
64250 22:50:18.906440348 3 stress (12721) > write fd=1(<f>/dev/pts/4) size=15
64251 22:50:18.906442301 3 stress (12721) < write res=15 data=.266.77M evt/s.
64254 22:50:18.906448753 3 stress (12721) > exit_group
64255 22:50:18.906504725 3 stress (12721) > procexit status=0
As expected, Sysdig doesn’t register any event, there are no direct system call invocations nor expensive page faults, which is the reason why this test performs so well.
vsyscall native
This time, I’m running the test inside the Redis container, so it will be using an old libc version without vDSO support for time(). The kernel is configured with native vsyscall support:
root@249d40385d6f:/# ./stress
8.4M evt/s
The throughput is much lower in this scenario, more similar to a typical system call invocation. In fact, as I said earlier, the kernel implements the native mode by putting a system call invocation at the address 0xffffffffff600400. I can verify this behavior with Sysdig:
[ubuntu@ip-10-1-1-103 ~]$ sudo sysdig proc.name=stress
...
2489715 23:13:41.761874936 1 stress (10190) > time
2489716 23:13:41.761875012 1 stress (10190) < time
2489717 23:13:41.761875297 1 stress (10190) > time
2489718 23:13:41.761875374 1 stress (10190) < time
2489719 23:13:41.761875659 1 stress (10190) > time
2489720 23:13:41.761875734 1 stress (10190) < time
2489721 23:13:41.761876019 1 stress (10190) > time
2489722 23:13:41.761876093 1 stress (10190) < time
...
Notice how each time() invocation from libc maps to one actual time() system call invocation, thus suffering the overhead of switching into kernel mode. It’s also quite interesting to use gdb and go poke into the vsyscall page directly injected by the kernel, and disassembling the first few bytes of it:
gianluca@sid:~$ gdb /bin/bash
(gdb) r
...
(gdb) disas 0xffffffffff600400, 0xffffffffff60040f
Dump of assembler code from 0xffffffffff600400 to 0xffffffffff60040f:
   0xffffffffff600400:  mov    $0xc9,%rax
   0xffffffffff600407:  syscall
   0xffffffffff600409:  retq
   0xffffffffff60040a:  int3
   0xffffffffff60040b:  int3
   0xffffffffff60040c:  int3
   0xffffffffff60040d:  int3
   0xffffffffff60040e:  int3
End of assembler dump.
(gdb)
As expected, the vsyscall page contains nothing more than the trampoline code to move the time() system call number into the rax register (201, or 0xc9) and then switching into the kernel with the syscall instruction. This code doesn’t come from any executable file or system library, it’s automatically injected by the kernel inside every process address space, whenever the native vsyscall mode is enabled of course.
vsyscall emulated
In this last scenario, the test is executed inside the Redis container, but the kernel is configured in emulated vsyscall mode. This is essentially the most common configuration for Linux distributions as of mid 2017, since it’s a good tradeoff between security and backwards compatibility:
root@249d40385d6f:/# ./stress
1.4M evt/s
This has the lowest throughput, almost 200 times slower than the vDSO one, and we can see with sysdig that the behavior is once again different:
[ubuntu@ip-10-1-1-103 ~]$ sudo sysdig proc.name=stress
...
727944 22:49:23.263406688 2 stress (12718) > page_fault addr=FFFFFFFFFF600400 ip=FFFFFFFFFF600400 error=153(PROTECTION_VIOLATION|READ_ACCESS|USER_FAULT|INSTRUCTION_FETCH)
727945 22:49:23.263407981 2 stress (12718) > page_fault addr=FFFFFFFFFF600400 ip=FFFFFFFFFF600400 error=153(PROTECTION_VIOLATION|READ_ACCESS|USER_FAULT|INSTRUCTION_FETCH)
727946 22:49:23.263409274 2 stress (12718) > page_fault addr=FFFFFFFFFF600400 ip=FFFFFFFFFF600400 error=153(PROTECTION_VIOLATION|READ_ACCESS|USER_FAULT|INSTRUCTION_FETCH)
727947 22:49:23.263410572 2 stress (12718) > page_fault addr=FFFFFFFFFF600400 ip=FFFFFFFFFF600400 error=153(PROTECTION_VIOLATION|READ_ACCESS|USER_FAULT|INSTRUCTION_FETCH)
...
In this scenario, we don’t see time() system call invocations since they are emulated, but we can notice how each individual time() call causes a trap into the kernel via a page fault event at the 0xffffffffff600400 address, and the kernel will then emulate the execution of the time() system call in the page fault handler. All this adds up to the final throughput of the application.
vsyscall trap via page table flags
As a last bit of trivia, it’s interesting to study the mechanics of how the libc is able to freely execute code from the vsyscall page in the native case, whereas in the emulated one there is a trap into the kernel. This is as easy as printing the kernel page table and searching for the vsyscall page address (although it requires a kernel with the debugging option CONFIG_X86_PTDUMP enabled):
gianluca@sid:~$ sudo cat /sys/kernel/debug/kernel_page_tables | grep 0xffffffffff600000
0xffffffffff600000-0xffffffffff601000           4K USR ro                 GLB x  pte
The page is marked as executable with the x flag, so, when the libc jumps into the area and tries to execute instructions from it, the execution will just continue unconditionally. Let’s compare it with the emulated case:
gianluca@sid:~$ sudo cat /sys/kernel/debug/kernel_page_tables | grep 0xffffffffff600000
0xffffffffff600000-0xffffffffff601000           4K USR ro                 GLB NX pte
Notice how this time the page is marked with the NX flag, which stands for Non-eXecute: whenever the CPU is asked to execute an instruction from an NX page, it will generate an exception and will call the page fault handler, allowing the kernel to intercept the libc call and emulate it properly. Both cases match the experimental observations done with Sysdig, since the page fault event is shown with the PROTECTION_VIOLATION flag.
So, running an application from a container based on an older container image has the potential of gratuitously slowing it down by a 200 factor. Of course, this is the most absolute extreme, in real life a system call such as time() wouldn’t be used millions of times per second and the total overhead would be mitigated, but this is still something worth keeping in mind, especially when running containers with very time sensitive requirements.
Conclusions
There are many conclusions to be drawn from this story. From a purely technical standpoint, it’s always fascinating to dig deep into the interactions between system and kernel and understand exactly the mechanics of crashes and performance issues.
From a more philosophical level, it’s clear that containers are stretching a bit some concepts on which Linux systems have strongly relied upon since the beginning of time: while traditionally there has always been a tight coupling between kernel and core userspace system libraries, and this synchronicity has always been carefully maintained by the Linux distribution developers, in the age of containers this coupling is not as strong, since each container can effectively ship whatever base image it wants, with its own version of core system libraries. It’s thus very important to take additional care and always use a recent base container image, and ideally keep an eye on what’s changing in the kernel / core Linux landscape.
That being said, the kernel community does a phenomenal job of maintaining a backwards-compatible kernel ABI with userspace, and this incident was mostly an unfortunate and rare coincidence of multiple events that caused me a couple hours of troubleshooting just to realize that we shouldn’t have trusted an old off the shelf image straight from the DockerHub. Since then, also the Redis upstream in the DockerHub switched to newer base images (first Debian Jessie and then Alpine), however, some old images such as the 2.8.22, weren’t properly updated and they are still faulty up to this day.