At Squarespace, the Edge team manages the TLS infrastructure, which handles the lifecycle of millions of SSL certificates used by our customers. This makes us one of the largest users of Let’s Encrypt, a free, automated, and open certificate authority (CA). We use PostgreSQL as the persistence storage for our SSL related data. Postgres is fronted by an in-memory caching layer for faster retrieval of data when users request it.
A few months ago, we started noticing higher than usual number of errors and corresponding alerts and warnings coming from our TLS infrastructure. Upon investigation, we found out most of these errors and warnings were related to database operations: connection timeouts, high query response latencies, etc.
At Squarespace, each engineering team is responsible for alerts generated by their services and are on call for those alerts. So we set out to discover what was ailing our systems and depriving us of our valuable sleep! This blog post is a summary of the work we did to improve our data layer performance and reduce errors and warnings coming from the database.
High Level Summary of the Work Done
Split reads/writes between primary and secondary databases.
Tuned database parameters like number of connections, timeout periods, retry counts, etc.
Added new indexes to take advantage of Postgres’ index-only scans.
Used separate services for reading and writing from the database.
Efficiently deleted unused data from very large tables.
Our Postgres Architecture
We run our TLS services across two data centers, with only one “active” at a time. Our Postgres replication operates natively in a primary/secondary relationship across those two data centers, where the active data center hosts the primary Postgres instance. Secondary nodes are located in both data centers.
The primary node is the only node that has the ability to accept writes, meaning you may execute all Postgres SQL commands against it. All secondaries are set to hot standby mode, which means you may run read-only queries against them.
Read from Secondary Databases
The first thing we did was switch to secondary Postgres instances for all reads. In the original setup, we had all our database operations directed to the primary database located in the active data center. We changed our TLS services’ database read configuration to read from secondary nodes in the active data center. This also meant we could read from the standby data center in case of problems with the database instances in the active data center.
Tweaking and Tuning Connection Parameters with High Performance Impact
We went over the configuration parameters we use to calibrate our Postgres read/write operations and identified and changed the ones that could lead to better resource utilization and increase the number of successful transactions:
We marked some transactions as read-only. We use the excellent HikariCP connection pooling tool for managing connections to Postgres. Marking a transaction read-only in HikariCP enables more efficient usage of the connection pool and results in lower latencies for all read operations executed through that connection pool.
We increased the number of concurrent connections to the database. Postgres operates on a process per connection model. It creates and dedicates a process (as opposed to a thread) for each connection it has open. This is more expensive than other models that maintain a thread or a coroutine per connection. Creating a new process or tearing down an existing one takes more CPU and RAM than the lighter alternatives. Even though one process per connection is rather resource intensive, we’ve found out that we were not maximizing resource usage in our database machines. The VMs we are using for hosting the Postgres instances allowed us to increase the number of connections from what we were using before. So we upped the number of connections to better utilize available resources.
We increased timeout periods for services with less stringent latency requirements. As a result, services could wait longer before erroring out. Not all services are in the critical path of user requests and responses. Less critical services could tolerate slightly longer waiting periods without sacrificing correctness or consistency of data.
We increased the number of retries for some services. We used to have retries of only once for unsuccessful queries. Following similar reasoning as #3 above for timeouts, we increased the number of retries from 1 to 3 for some services. This meant those services could now try more than once before throwing an error.
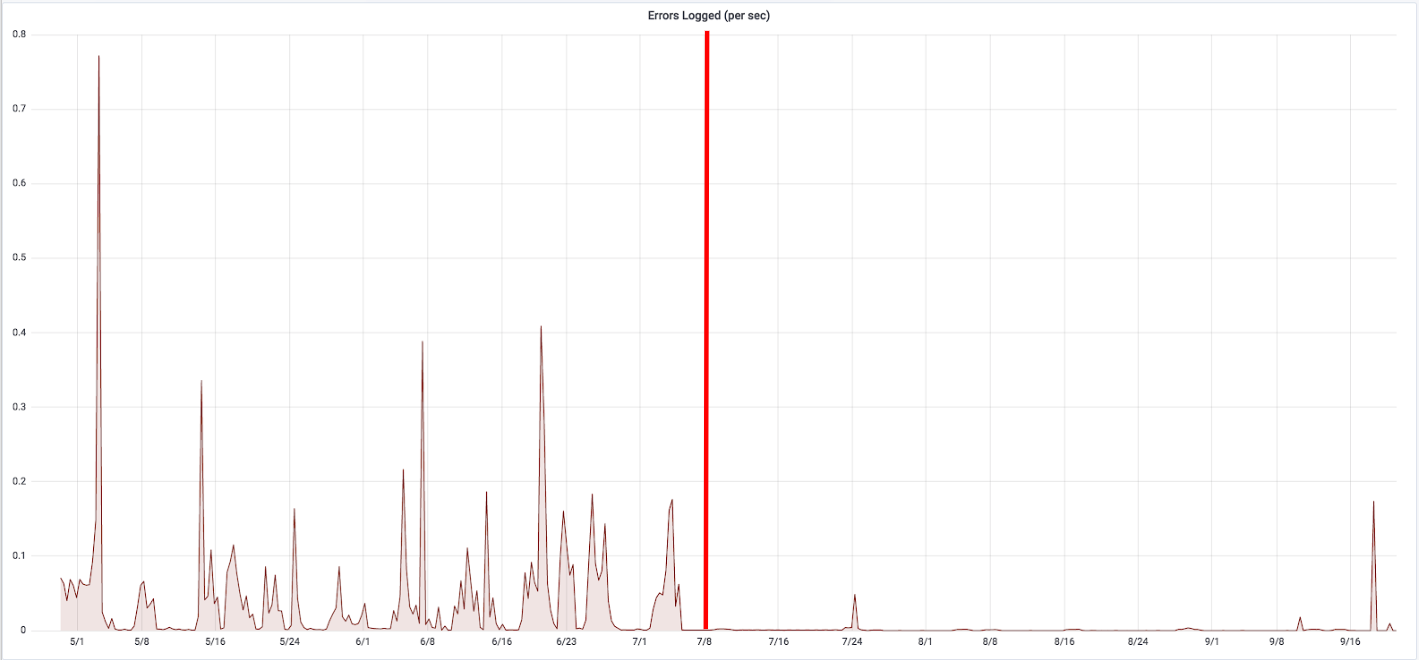
All these configuration changes resulted in substantial reduction of database errors related to unavailability of connections, timing out while waiting for responses, and not being able to successfully execute queries.
Errors improvement:
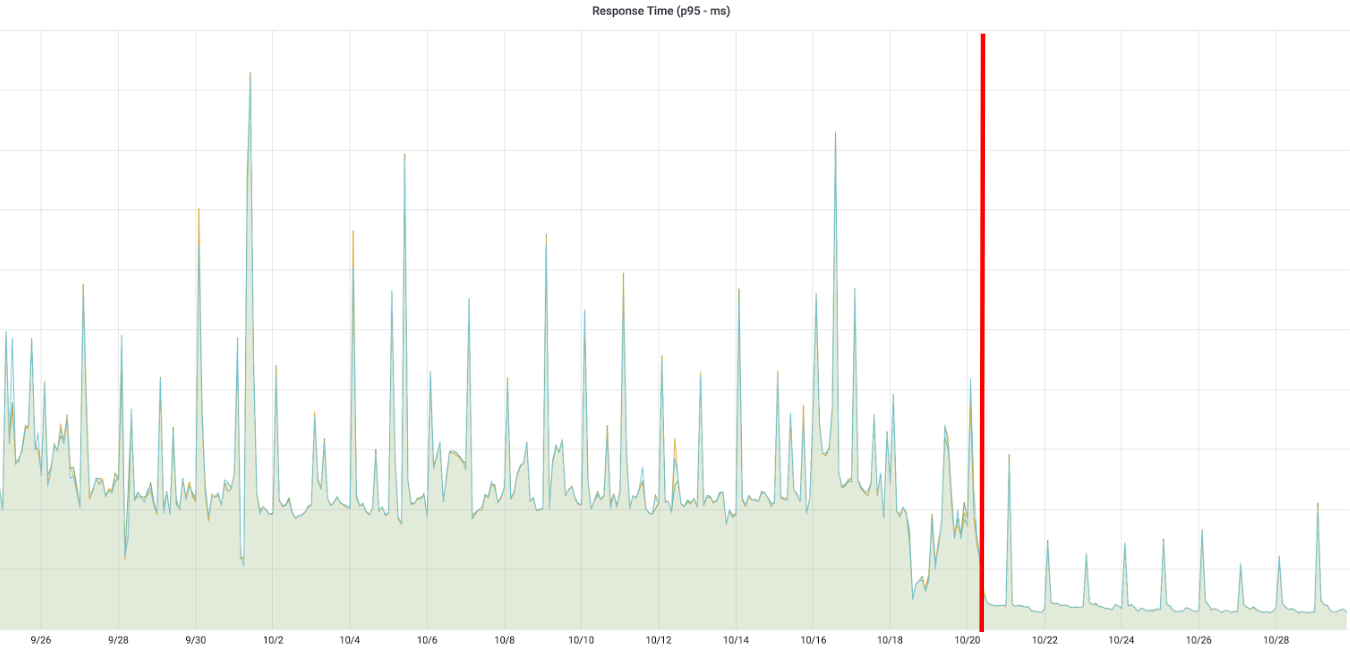
Read p95 improvement:

Response time p99 improvement:

Number of Connections improvement:

Taking Advantage of Index-only Scan
We used Postgres’ EXPLAIN [ANALYZE] and the very helpful PgHero tool to find out our slowest queries. Once we had a list of queries that we wanted to improve, we started to figure out ways to optimize the response latencies of those queries.
When operating on a table, Postgres has the option to do an index-only scan of the table. In this mode, it works on an index data structure instead of the much larger main table. Index-only scans usually perform much faster than table scans.
In order to take advantage of index-only scans, we added new indexes based on our query patterns. And it did make a big difference in the performance of our queries.
Queries that had a count(*) clause in them saw the most improvement. A query like
select count(*) from categories
where 2nd_indexed_col >= 500 and 3rd_indexed_col >= 1000 ;
where there’s only one index with the primary key (1st_indexed_col), can be made to take advantage of the index-only scan by adding additional indexes on the following columns:
2nd_indexed_col, 3rd_indexed_col;With a composite index on (2nd_indexed_col, 3rd_indexed_col), the query can perform several orders of magnitude faster depending on the table data and size.
After we added the new indexes, some of the queries saw 3 orders of magnitude improvements in response time. Many slow queries saw about 10x improvements in response time.
This also helped us reduce errors due to connection timeout (due to high latency):

Separate out Non-user Facing Code from Time Critical User Facing Code
We run several (micro-)services as part of our TLS infrastructure. These are critical services for Squarespace customers as they provide safety and security of all user data at rest in our platform and in transit between Squarespace and users.
A non-trivial part of these services is dedicated to collecting various metrics and data points for monitoring the health of the services. Some other parts of the services run background tasks which typically include tasks we need to run periodically to keep the data consistent and up-to-date. We decided to remove these functionalities from the more critical and time sensitive user serving code to relieve the machines running those services from potential resource starvation and also to move some of the database operations to read-only mode.
We moved all metrics generating and background tasks related code to a new service. And we made the new service to only read from a secondary Postgres instance, while keeping the user-facing code attached to the primary Postgres. The metrics are written out to a different database than TLS’ Postgres, so making it read-only was not a problem. The background tasks write out to a queueing system, which is later drained by the other services, so that was also not a blocker in making the new service read-only for the Postgres database.
Revamped Data Retention Policy and Implementation
Some of the tables in our database have billions of rows. Each row of data become obsolete after a certain amount of time. We did not really need to hold on to data that have become obsolete. Very large tables meant some of the queries would take much longer before returning desired data from those tables. Accordingly, we implemented a new data purging scheme to delete old data from our system.
Our old data deletion process wasn’t very scalable as it tried to delete too many rows of data at the same time at a certain point in the day. With our new scheme, we now delete data in more granular batches. For implementing this new batching process we utilized a message queue which would be populated with batches of data that are eligible for deletion from the database. A consumer process will drain the queue and delete those batches of data from the database. To reduce load on the database, we restrict the message queue producer process to a secondary Postgres instance in read-only mode. The consumer process operates with the primary Postgres instance as it modifies (deletes) the content of the database.
This new data retention policy implementation resulted in a much smoother data deletion process and reduced our database size by half.
These changes resulted in some dramatic improvements of query times, resource utilization, p95 error rates, database size, etc.
CPU load improvements:

Overall Results
All these changes have helped us make a robust and efficient data layer for our TLS infrastructure.
In a nutshell, we’ve achieved:
No errors related to database connections or timeouts. Database connections are now being used very efficiently across all our services. This had dramatic effects on upstream services that depend on the results from the data layer, which in turn has helped to provide a smoother TLS security experience for our customers.
Reduced PagerDuty alerts. We now get paged significantly less often. Being on-call is now a rather pleasant experience thanks to all these changes we made in the data layer.
Average p95 of response time went down to ~50 milliseconds from over 200 ms. Upstream services now see snappier responses from the database.
Reduced CPU load on Postgres, especially the primary instance. Typical CPU usage came down to below 10% meaning plenty of CPU bandwidth left for unexpected surge in requests.
Database size reduced by half thanks to the new data retention policy implementation.