From the latest crisis over plans for Hinkley Point in the UK, to Friday’s fifth anniversary of the Fukushima disaster, nuclear power plants are currently much in the news.
To help provide a global overview of the nuclear power sector both today and throughout its history, Carbon Brief has produced this interactive map.
It shows the location, operating status and generating capacity of all 667 reactors that have been built, or are under construction, around the world, ever since Russia’s tiny Obninsk plant became the first to supply power to the grid in 1954.
Changing fortunes
For some, the technology has fallen out of favour. Lithuania and Italy have shut down all of their reactors. Germany’s are being phased out. All except three of Japan’s remain offline following the tsunami of 11 March 2011, and the nuclear accident that followed.
For others, nuclear offers low-carbon energy and reduced reliance on dirty, imported fossil fuels. There are now 66 reactors under construction in 16 countries, including 24 in China.
Today, there are 400 reactors operating across 31 nations. Most were built in the two decades after 1970, giving the world’s fleet an average age of 29. This average varies regionally (see below).
The total global generating capacity for nuclear power is 345 gigawatts (GW). This is down from a peak of 378GW in 2005, largely as a result of reactors being taken offline post-Fukushima.
Whereas “shutdown” reactors will remain closed, those that are “offline” could be restarted. (Where reactors in different categories are close together on the map above, their bubbles can overlap and the colours can become mixed. You can show each category in isolation by clicking on the tabs in the top right-hand corner.)
Global nuclear power generating capacity
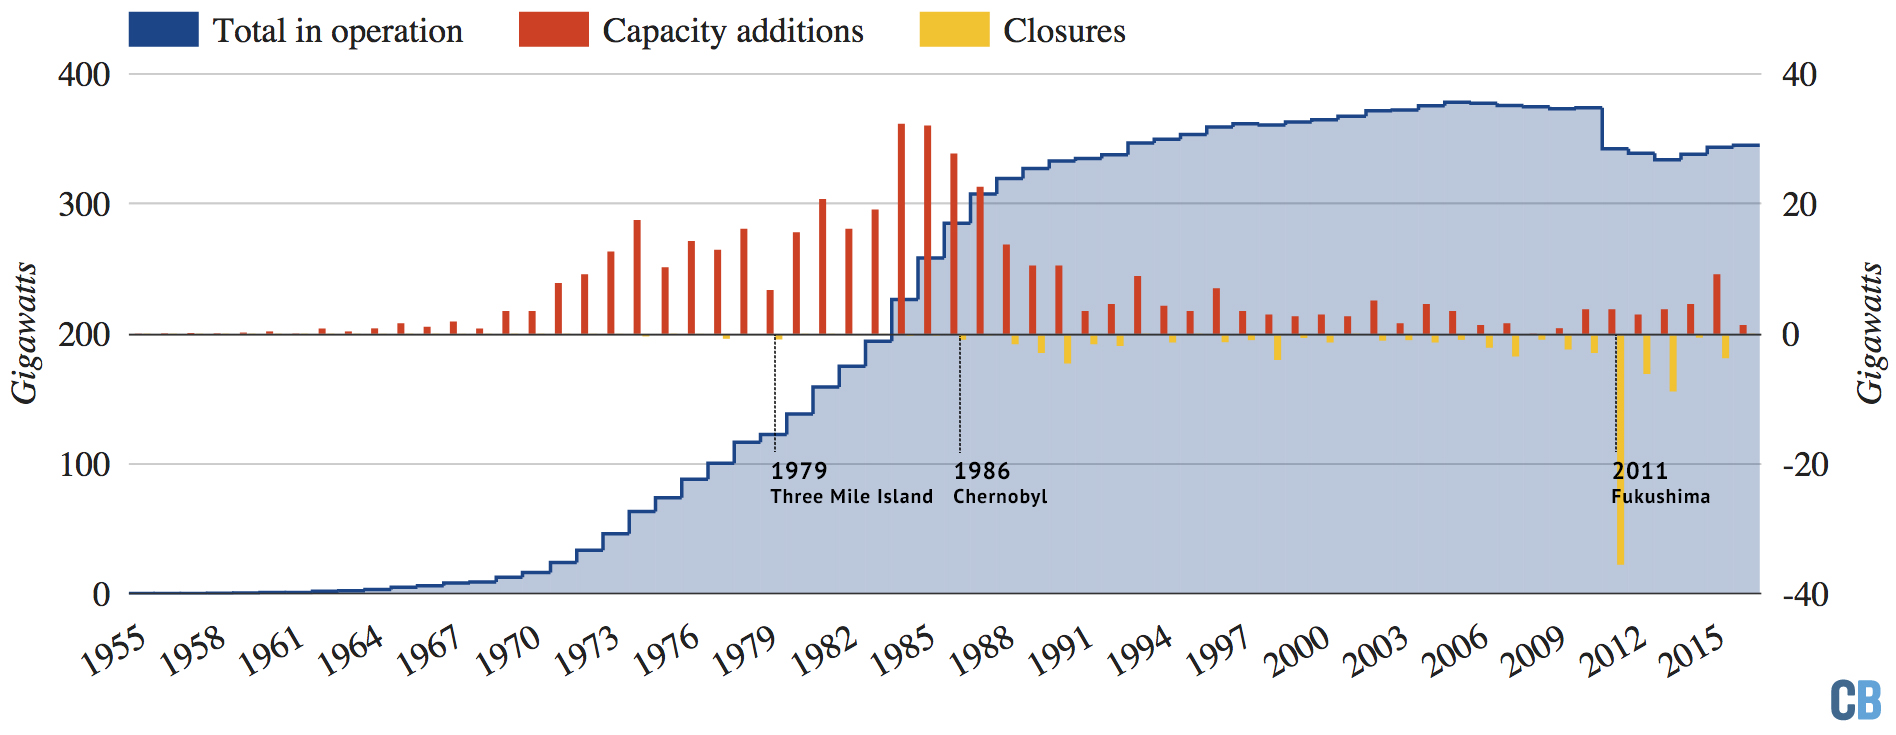
Total global nuclear power generating capacity in operation between 1955 and 2016 (blue area, left axis). Annual additions (red bars, right axis) and the capacity of reactors going offline or being shut down (yellow bars, right axis). Source: International Atomic Energy Agency (IAEA) PRIS database and Carbon Brief analysis. Chart by Carbon Brief.
Apart from Fukushima, the nuclear industry has witnessed two other major disasters, both of which have had lasting international consequences.
Construction delays
The first, in 1979, was at Three Mile Island in the US. In the decade before the accident, construction started on an average of 24 new reactors each year around the world. In the decade after, that fell to just 10.
In the wake of Three Mile Island, reactor designs were tweaked and safety specifications added. With changes applied retrospectively to reactors already under construction, there were inevitable delays and average build times increased, particularly in the US itself.
Annual capacity additions and construction times
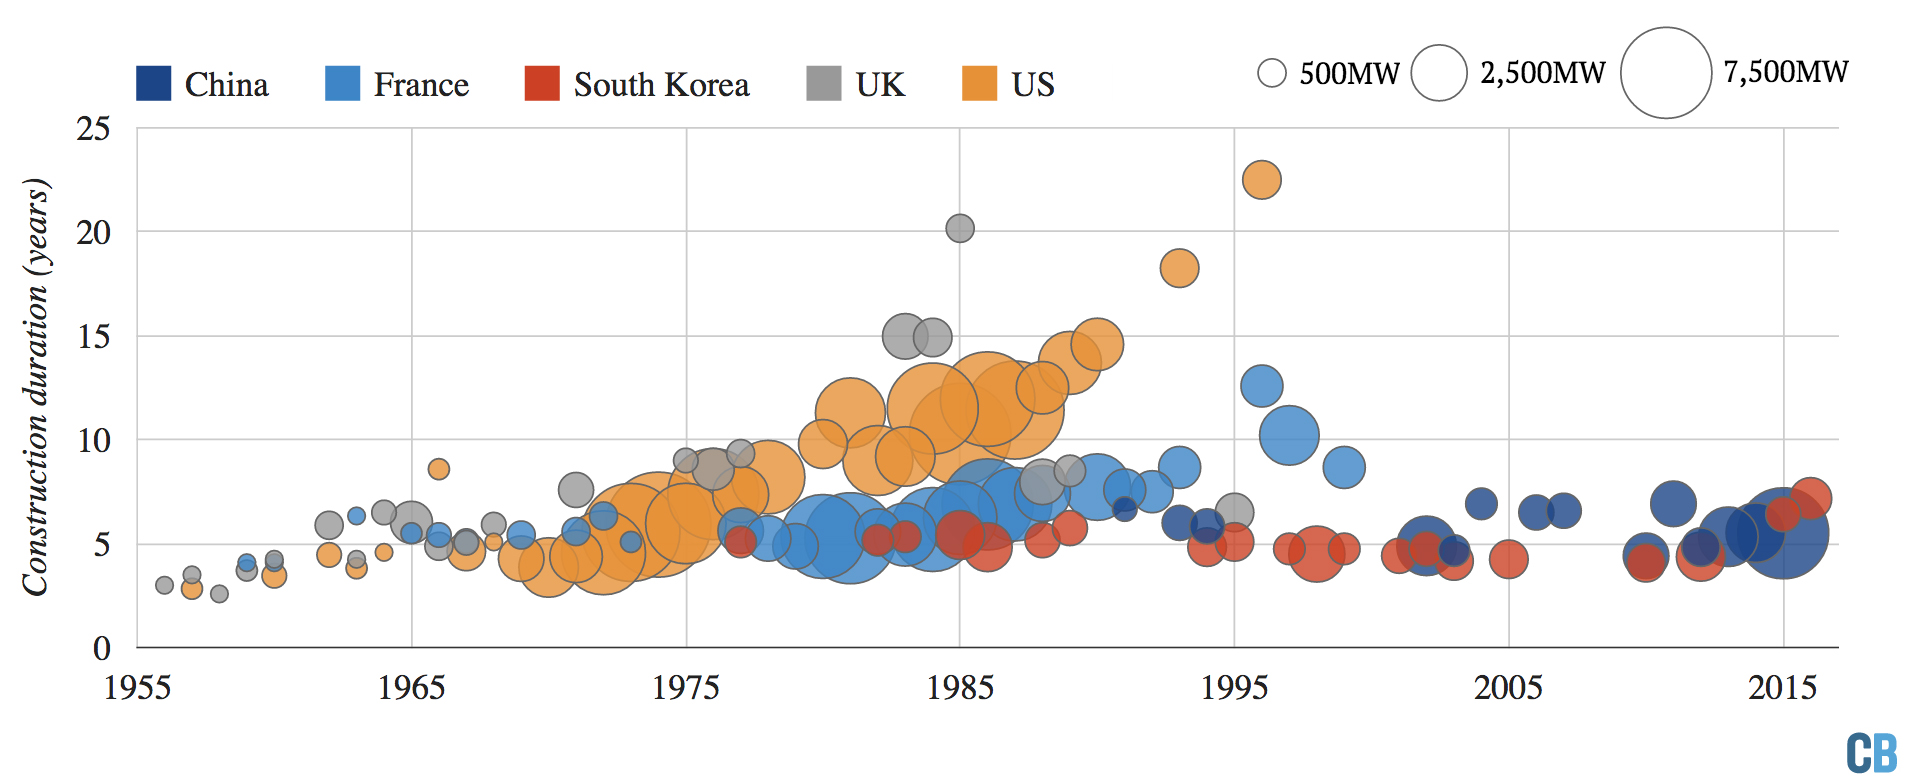
Average construction duration for reactors coming online between 1955 and 2016. The size of the bubble is proportional to the capacity added that year. Source: IAEA PRIS database and Carbon Brief analysis. Chart by Carbon Brief.
More stringent safety standards and construction delays also added to costs, and enthusiasm for new nuclear waned. This has been described as a case of “negative learning by doing”, with nuclear costs increasing as capacity has grown.
According to the Nuclear Energy Agency, new nuclear power stations in the UK, such as the planned Hinkley Point C plant, would be the world’s most costly.
It’s worth noting, however, that some countries have managed to keep a lid on build times, as the chart above shows. They have also limited cost increases, with South Korea reported to have reduced costs as its experience has grown. Some analysts question cost data for South Korea, arguing it is in any case an exception to the trend of rising costs.
Falling shares
The second major disaster to hit the world’s nuclear industry was Chernobyl, which took place 30 years ago, in April 1986. The last of Chernobyl’s four reactors continued to operate for another 14 years, until 2000.
In the 25 years after Chernobyl, nuclear construction declined while global demand for electricity more than doubled. As a result, nuclear’s share of total electricity supplies peaked just shy of 18% in 1996 before falling to 11% in 2014.
Nuclear electricity generation
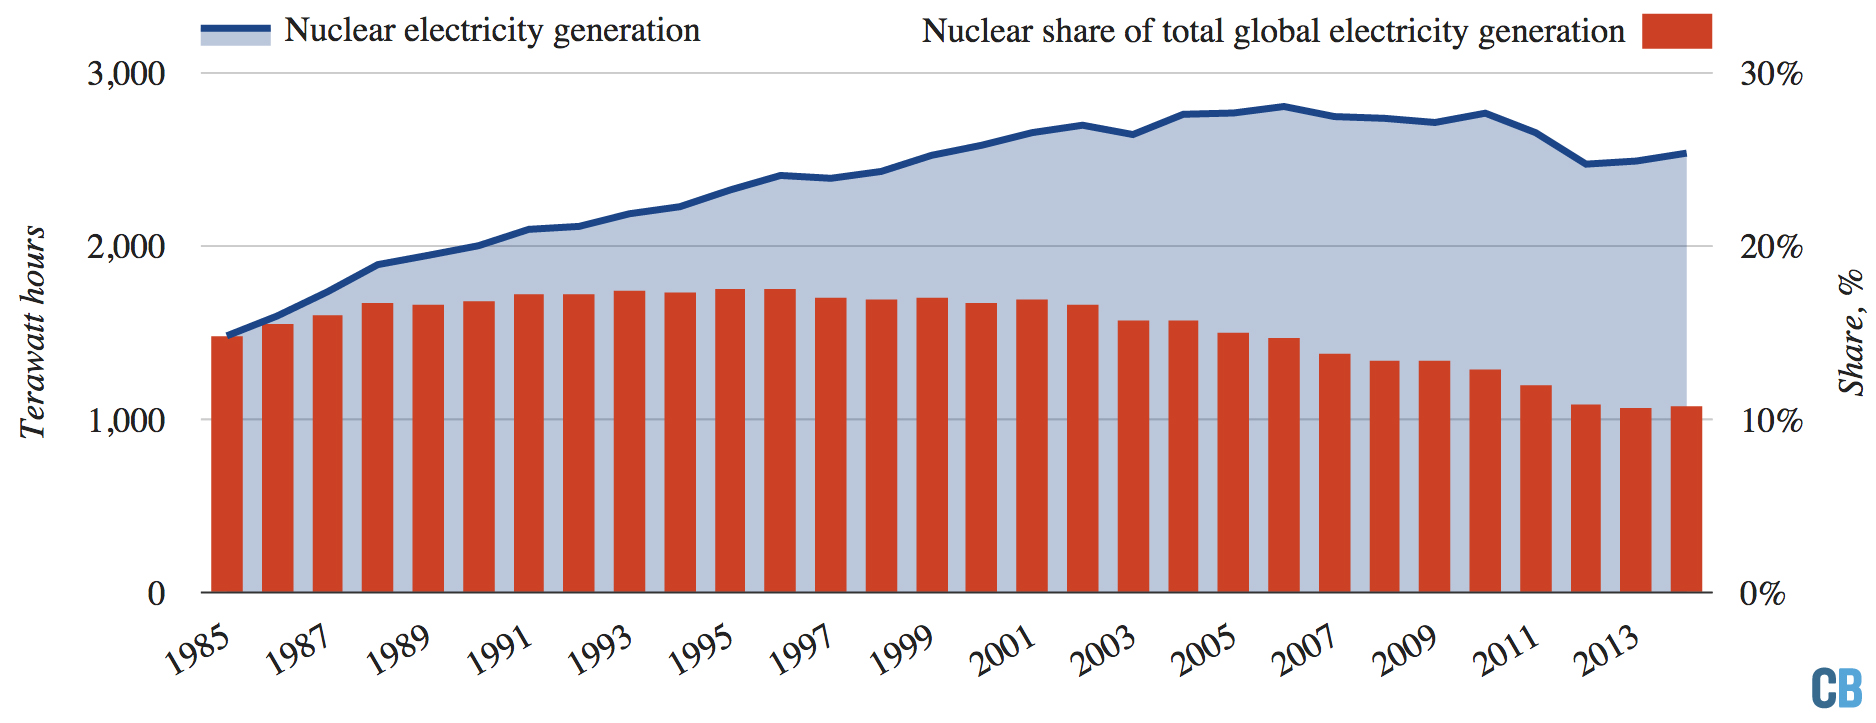
Global nuclear electricity generation (blue area, left axis) and nuclear’s share of total world power generation (red bars, right axis). Source: BP Statistical Review of World Energy 2015 and Carbon Brief analysis. Chart by Carbon Brief.
According to the International Energy Agency, the rate at which new reactors are being added needs to quadruple by 2020 if the world is to meet its climate targets.
Today, the majority of the world’s reactors are concentrated in three broad regions: the eastern US; Europe and the westernmost former Soviet states; and the far east (see map).
Ageing fleet
The age distribution varies widely in each region. US reactors are the world’s oldest, with an average age of 36. Those in former Soviet states and the EU average around 31 years. Note that Chernobyl was 30 years ago.
Over the past 20 years, Asia has been the leading light of the nuclear industry. In that time, it has added 51 new reactors, while the rest of the world combined has built 30. China has the world’s youngest fleet, with an average age of less than eight.
Surprisingly, perhaps, India has one of the world’s oldest operating nuclear power stations, the 47-year-old Tarapur plant. India has ambitious plans to increase its nuclear capacity as part of its efforts to reduce greenhouse gas emissions.
Africa has just one operating nuclear power station, at Koeburg in South Africa. South America has two, one each in Argentina and Brazil. These are shown, along with Switzerland and Iran, in the chart of “other countries”, below
Age of currently operating nuclear reactors
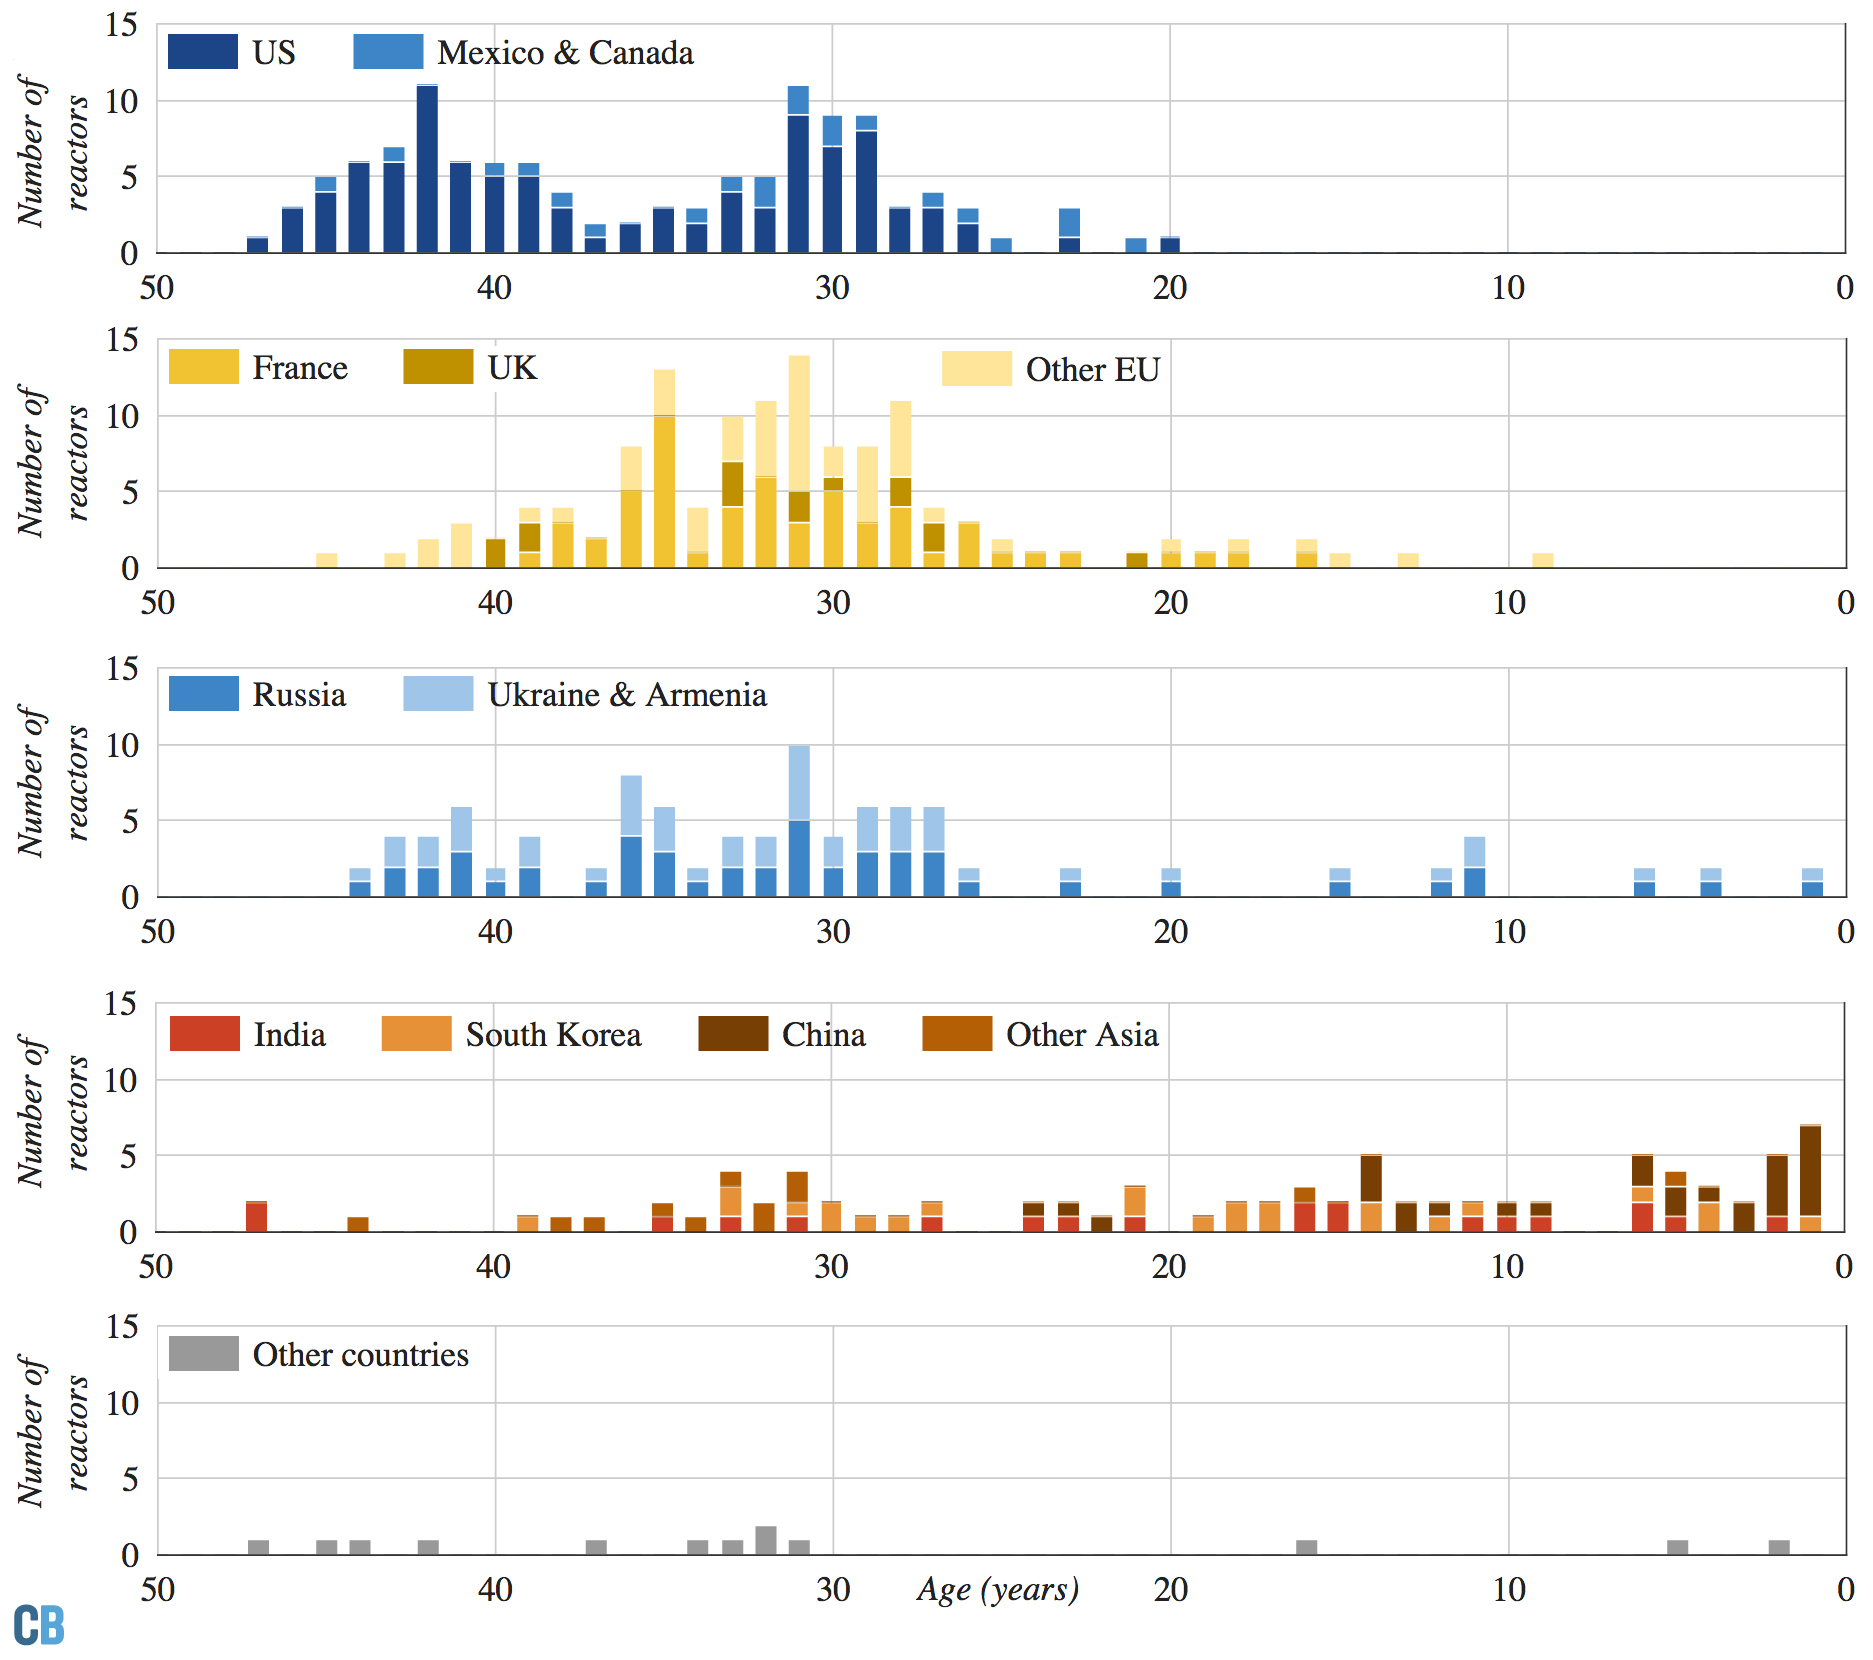
Average age of the nuclear reactors operating today in north America (top panel), EU nations (second panel), former Soviet states (centre panel), Asia (fourth panel) and other countries (bottom panel). Other EU is Germany, Sweden, Finland, Bulgaria, Romania, Belgium, Netherlands, Czech Republic, Slovakia, Slovenia and Spain. Other Asia is Pakistan, Taiwan and Japan. Source: IAEA PRIS database and Carbon Brief analysis. Chart by Carbon Brief.
In terms of generating capacity, the world’s top nuclear powers are the US, France, China, Russia and South Korea. However, their age profiles differ markedly.
Asian accelerators
Whereas western nations’ nuclear power capacities are static or declining, China’s is accelerating rapidly and set to grow further. Russia and South Korea are also expanding.
Cumulative nuclear capacity in operation
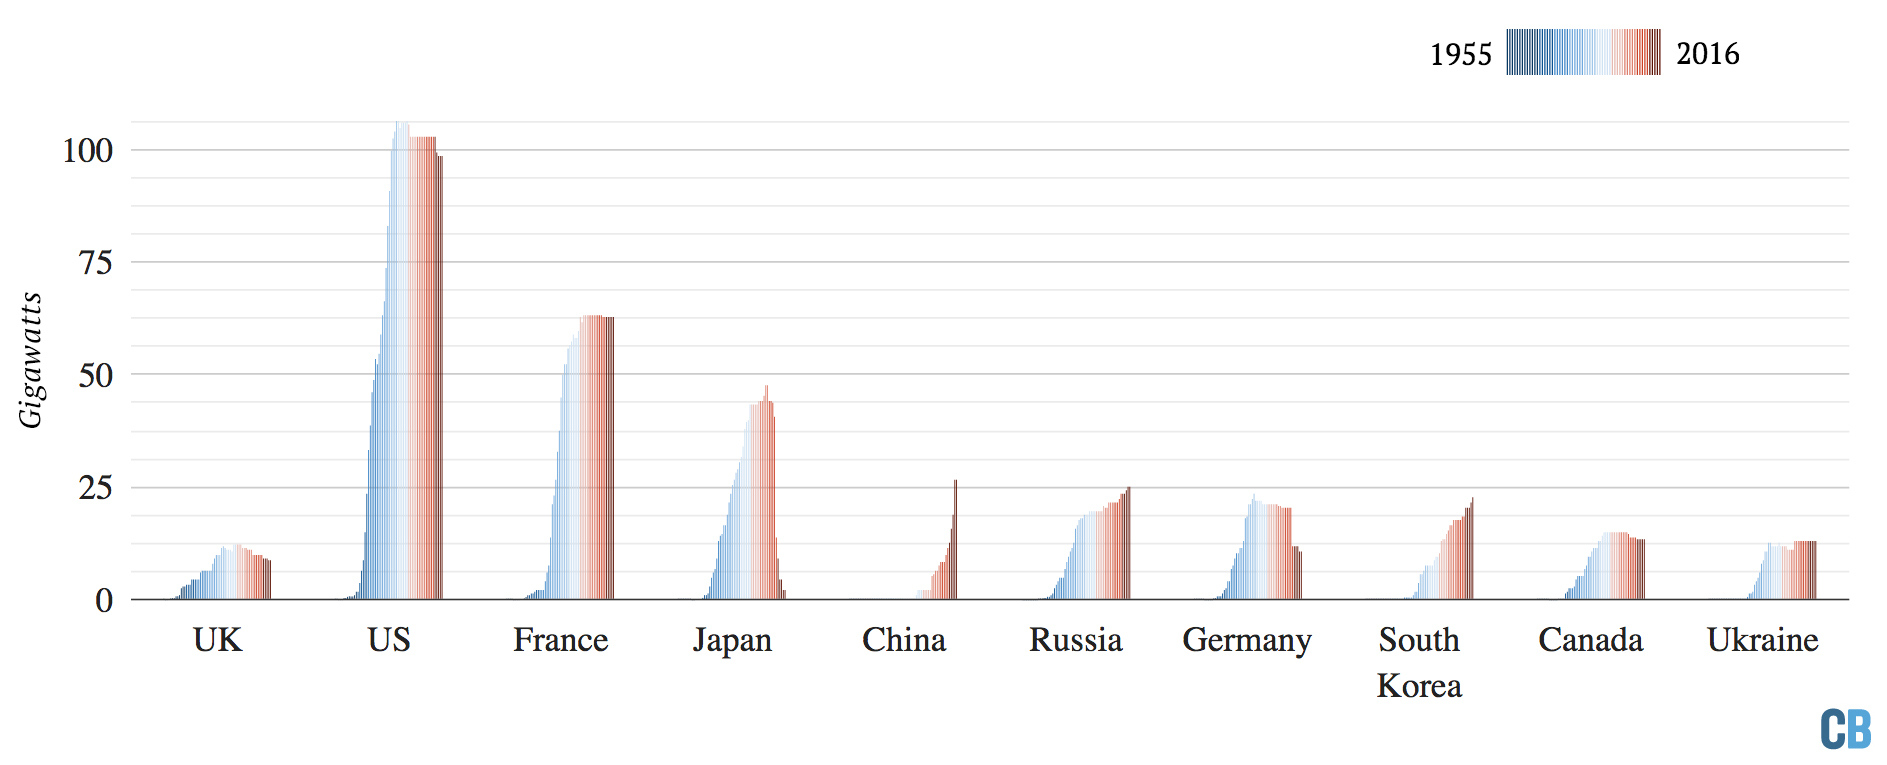
Cumulative nuclear power capacity in operation in the top 10 nations between 1955 (dark blue) and 2016 (dark red). Source: IAEA PRIS database and Carbon Brief analysis. Chart by Carbon Brief.
Until Fukushima, Japan was operating the third-largest capacity in the world. Nuclear is a significant part of the country’s plans to tackle climate change. Three reactors have now reopened and many more plan to follow. (Update 9/3: Since this article was published a Japanese court has issued an injunction against the restart of one of these three reactors).
In contrast, Germany responded to Fukushima by accelerating its plans to phase out nuclear power, closing eight reactors in 2011. It plans to close all reactors by 2022.
Globally, Belarus and the United Arab Emirates are in the process of joining the nuclear power club. If successful, the UK’s plans for a new generation of 19GW of reactors would make it once again one of the world’s leading nuclear nations.
Note: The interactive map and associated charts are based on an extract of data from the IAEA PRIS database, kindly provided by the IAEA. The database lists reactors as “under construction”, “operational”, “long term shutdown” or “permanent shutdown”. The PRIS category “operational” includes 41 Japanese reactors that have not generated electricity for several years. Carbon Brief has listed “long term shutdown” plants and some Japanese reactors as “offline”, based on information from the Japan Atomic Industrial Forum.
Main image: 26 Feb 2016, Antwerp, Belgium — Steam rises from the cooling towers of the Doel nuclear power station in Antwerp, Belgium. © Oliver Berg/dpa/Corbis
-
Mapped: The world's nuclear power plants
-
Nuclear power plants across the world
-
400 reactors in 31 nations: The world's nuclear power plants mapped