Distributing digital media: How we improved throughput by 4x

Alistair Wooldrige
Senior Software Engineer
Tagged with:
BBC Digital Media Distribution has been working to deliver more throughput from their caching infrastructure. Senior Software Engineer Alistair Wooldrige explains how the team diagnosed poor performance with existing software and why replacing it achieved a 4x increase in performance.
Within the BBC Digital Media Distribution team, we used Varnish cache for the first version of our Radix caching servers. A Radix server caches HTTP responses from origin servers - usually video and audio content for iPlayer, delivered using one of the HTTP Adaptive bitrate streaming formats such as MPEG-DASH, HLS or HDS. For more information on Radix and our overall caching strategy, see Digital Distribution: How on demand content reaches audiences.
Varnish soon became a bottleneck in the caching server architecture. It only managed to serve 4 Gbps during load tests. This post investigates why internal Varnish architecture limited a caching server to 4 Gbps, and why replacing Varnish with nginx increased output to 20 Gbps.

Radix caching server configuration
Hardware & software
High spec hardware is used for the caching servers. Each server is a HP ProLiant DL380 Gen9 consisting of:
- 48 logical CPUs from 2 Intel® Xeon® E5-2680v3 processors
- 512 GiB DDR4 RAM
- 23 x 480 GB Kingston SSDNow E5 SSD drives in RAID 50 configuration (using an HP P440ar 2 GiB FBWC Smart Array controller) for a total of 8.6 TiB storage
- 40 Gbps aggregate full duplex fibre network connectivity
- Red Hat Enterprise Linux (RHEL) Server 6.6 (Linux kernel 2.6.32-504)
- Varnish cache 4.0.2
Varnish configuration
Varnish startup parameters are optimised for both caching server hardware and projected workload:
varnishd \
    -p thread_pools=16 \
    -p fetch_chunksize=131072 \
    -p thread_pool_min=200 \
    -p thread_pool_max=5000 \
    -p thread_pool_timeout=120 \
    -p thread_pool_add_delay=2 \
    -p lru_interval=30 \
    -s file,/cache/,11%,256k \
    -s file,/cache/,11%,256k \
    -s file,/cache/,11%,256k \
    -s file,/cache/,11%,256k \
    -s file,/cache/,11%,256k \
    -s file,/cache/,11%,256k \
    -s file,/cache/,11%,256k \
    -s file,/cache/,11%,256k \
    # ... and other non-performance related parameters
Of the above, there are a few of note:
- The file storage backend is specified using 8 memory mapped (mmap(2)) backing files that reside on the 8.6 TiB SSD RAID 50 array. RAID is required as this storage backend cannot tolerate disk failures.
- The number of thread pools is increased from 2 to 16, with a minimum of 200 and a maximum of 5000 threads in each.
- Every time an object is requested, the list of least recently used (LRU) objects is updated to move the newly requested object to the front. These operations require locking the LRU list. To relieve pressure on this lock, lru_interval is raised from 2 seconds to 30.
- A caching server's workload involves video file chunks rather than lots of small HTML pages, so the allocation granularity is raised to 256 KiB.
Varnish cache - what went wrong?
1) Poor performance of accessing large memory mapped files
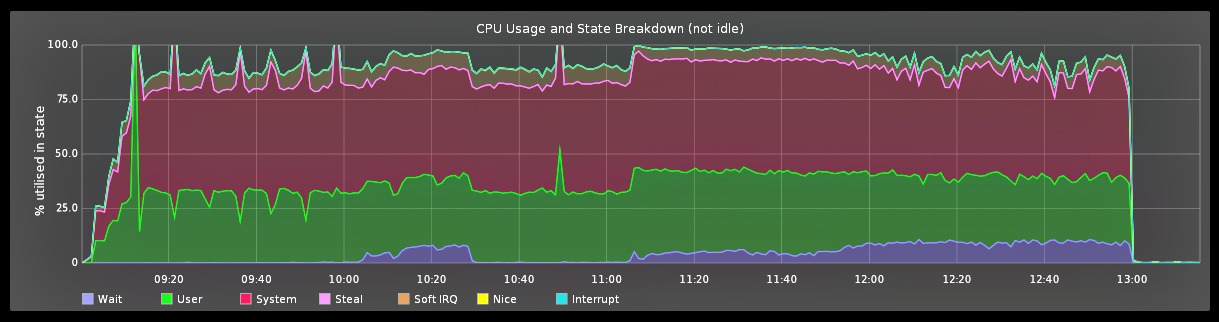
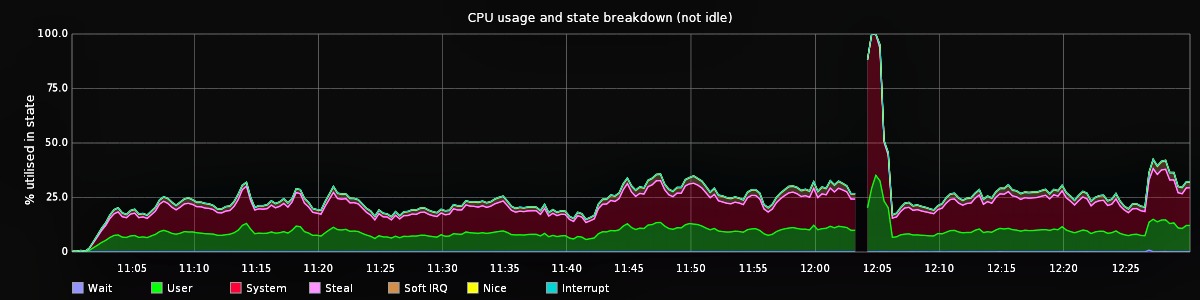
When moderately loaded, all 48 cores of the caching server are heavily utilised as shown in this CPU utilisation graph:

You can see a larger version of the graph here.
The graph shows most cycles are spent executing kernel instructions rather than user space Varnish instructions. The large kernel overhead is not ideal and is due to:
- Varnish instructing the kernel to memory map files from the backing store into virtual memory using mmap(2).
- Having a considerably larger backing store compared to the amount of RAM. The Varnish backing store is 8.6 TiB whereas only 512 GiB RAM is available.
- Having a working set of regularly requested content also larger than the 512 GiB of RAM.
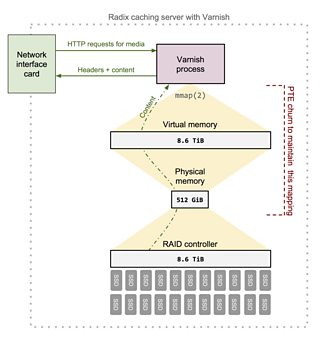
The combination of characteristics above causes huge pressure on the virtual memory (VM) subsystem due to extensive dirty page writeback and page steals. The VM subsystem is constantly modifying page table entries (PTEs). This PTE churn results in frequent translation lookaside buffer (TLB) flushes and many inter-processor interrupts (IPIs) to do so. These TLB flushes have a very negative performance hit. The VM bottleneck is shown in the diagram below:
PTE churn deep dive: compare requests made to cold/warm caching server
Consider the situation of a cold caching server entering active service. Requests result in a cache miss - Varnish fetches content from origin and writes it to the memory mapped area. When this write is issued:
- The CPU page faults as no TLB or PTE entries exist for the address being written to. The CPU calls the kernel's page fault handler.
- The handler finds the file backed vm_area_struct representing the faulted address and a lookup is made in the page cache for the backing file's inode's address_space and page index that covers the faulted address. The page cache does not have a copy.
- The page cache allocates a new page frame for the handler. Plenty of RAM is available so get_free_page() quickly returns a page.
- The kernel wires the physical page frame to VM by adding PTEs, which later result in new TLB entries created by the CPU.
- Control is switched back to Varnish and it continues writing content to the memory area with the above operations being transparent to Varnish. Now the page is marked as dirty.
The above scenario executes quickly, as content has only been written to pages in RAM, not directly to disk. Let's compare the above scenario to one where the caching server is warm - it has been in service for enough time to utilise the backing store. Due to the large difference between available RAM and the size of the backing store, the RAM page cache contains a minority of the 8.6 TiB working set, most cached content must be read from the backing store. When a request arrives for cached content, Varnish reads from a VM address of the memory mapped file. After the CPU has page faulted and no entry found in the page cache, the page cache needs to allocate a new page frame. With a cold caching server, there is little overhead, but now the overhead is significant:
- When get_free_page() is called, RAM is fully utilised so the kernel must steal a page already in use.
- The cache eviction algorithm selects an old page suitable for eviction. If the page is dirty, an I/O operation is scheduled to write the content to the backing store, which adds extra delay.
- To steal the page, the kernel must update all PTEs referencing that page frame and clear the present bit. Moreover, it must invalidate the TLB and may need to issue an IPI to invalidate TLBs on other CPUs. These operations can take hundreds of CPU cycles. Once complete the page frame can be returned to the handler.
- The handler schedules an I/O operation, instructing the file system to load a page worth of data from the backing store into the allocated page.
- When the I/O operation completes, the entry is added to the page cache's LRU list and the data now resides in the page cache. As the handler is dealing with a page fault for a memory mapped file, it sets the PTE to the same page frame as this page cache entry.
- The kernel returns to user space and Varnish proceeds serving the content to the client.
Note that all disk I/O in Linux goes through the page cache - whether reading/writing to a VM area representing a memory mapped file, or just using the standard read(2)/write(2) system calls. Linux decides when it needs to write this data back to the file on disk at a later time - this is known as write-back caching. The readahead mechanism within the kernel pre-emptively loads pages into the page cache before they have been accessed. Varnish advises the kernel using madvise(2) that the memory mapped files are accessed in random order (by supplying MADV_RANDOM) to prevent this behaviour.
The TLB flushes are shown to impact performance during profiling (see perf record -g output later on in this post). A large percentage of CPU time is spent in the smp_invalidate_interrupt function, which is the TLB flush IPI handler.
2) Lock contention in the VM subsystem
When a caching server is under moderate load, there are periods of several minutes when the machine becomes unresponsive and no content is served to the client. As well as occurring sporadically, they consistently occur when RAM becomes fully utilised by the page cache, for example shortly after introducing a cold machine into service. During these unresponsive periods our monitoring system receives no data, which can be seen as a gap in the following RAM utilisation graph:
You can see a larger version of the graph here.
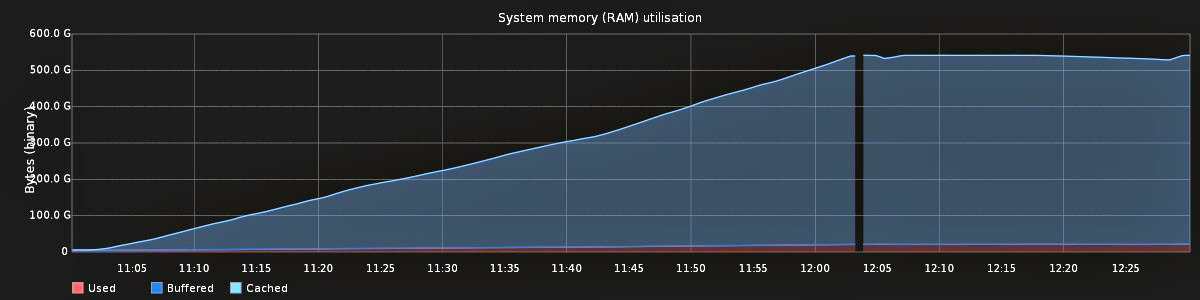
Load average also spikes during these unresponsive periods:

You can see a larger version of the graph here.
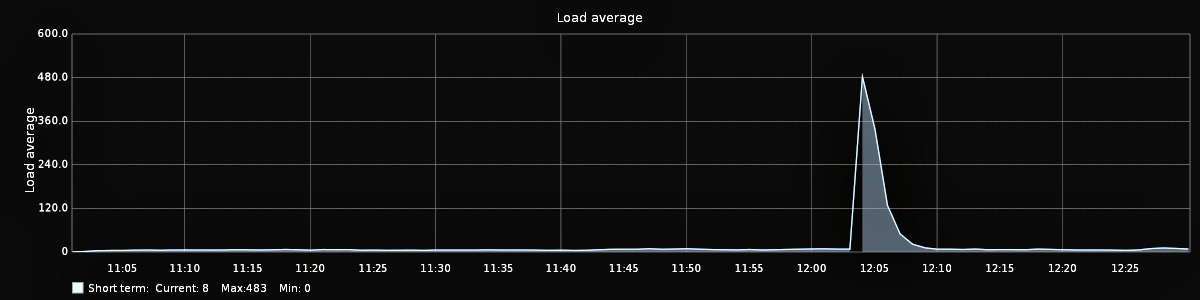
Diagnosis steps
Observing CPU utilisation during unresponsive periods reveals cycles are mostly being used by the kernel:
You can see a larger version of the graph here.
Statistically profiling the system during this period using perf-record(1) and perf-report(1) tools provides useful insight. These tools interface with the Linux Performance Counters feature - available since 2.6.31. Running perf record -g over an unresponsive period captures the counters, then inspecting the results after with perf report -i ./perf.data produces:
Samples: 469K of event 'cycles', Event count (approx.): 352595271323
    -  71.98%  varnishd  [kernel.kallsyms]   [k] _spin_lock
       - _spin_lock
          - 99.42% page_referenced
               shrink_page_list.clone.3
               shrink_inactive_list
               shrink_mem_cgroup_zone
               shrink_zone
               do_try_to_free_pages
               try_to_free_pages
             - __alloc_pages_nodemask
                - 99.27% alloc_pages_current
                   - 75.18% __page_cache_alloc
                        filemap_fault
                        __do_fault
                        handle_pte_fault
                        handle_mm_fault
                        __do_page_fault
                        do_page_fault
                      - page_fault
                         - 86.79% skb_copy_datagram_iovec
                            - 68.64% tcp_recvmsg
                                 inet_recvmsg
                                 sock_aio_read
                                 do_sync_read
                                 vfs_read
                                 sys_read
                                 system_call_fastpath
                               + 0x7f8e4d58a75d
                            - 31.36% tcp_rcv_established
                               - tcp_v4_do_rcv
                                  + 89.32% release_sock
                                  + 10.68% tcp_prequeue_process
                         + 13.21% memcpy
                   + 21.34% pte_alloc_one
                   + 3.47% tcp_sendmsg
                - 0.73% copy_process
                     do_fork
                     sys_clone
                     stub_clone
                     __clone
    +   8.16%  varnishd  [kernel.kallsyms]   [k] smp_invalidate_interrupt
    +   1.69%  varnishd  [kernel.kallsyms]   [k] default_send_IPI_mask_sequence_phys
    +   1.07%  varnishd  [kernel.kallsyms]   [k] _spin_lock_irq
    +   1.06%  varnishd  [kernel.kallsyms]   [k] __bitmap_empty
    ...
The report highlights a significant amount of time is spent contended on spinlocks within shrink_page_list, shrink_inactive_list and other functions related to scanning page lists. Code inspection suggests that for page cache intensive workloads this is an area of known contention.
Deep dive: why Varnish stops serving content during a spinlock
Shortly after a cold machine enters service and the page cache exhausts available RAM, there are many dirty pages that need laundering. At this point many Varnish workers are servicing cache misses at once, all page faulting, and all entering the direct reclaim path of the kernel VM subsystem that must steal dirty pages for use by the page cache:
- To scan page lists, various locks must be acquired (see lock order in rmap.c). These locks ensure only one thread can be scanning and directly reclaiming pages at a time.
- Whilst one worker is evicting pages, all others are spinlocking. As the direct reclaim of pages occurs in the foreground of the Varnish thread, there's nothing else Varnish can do - all content serving immediately grinds to a halt.
- This busy wait spinlocking occurs in multiple threads at once, and in the kernel space, so the CPU quickly becomes fully utilised and no other tasks (including monitoring and sshd) get a chance to run. The entire system becomes unresponsive until the necessary I/O operation completes to writeback dirty pages, steal them and return the page to the fault handler.
System tuning to alleviate the problem
We tried different kernel versions and tuned kernel parameters using sysctl(8) to reduce pressure on the VM subsystem. These changed included:
- Experimenting with different zoned memory reclamation modes to reduce contention on the zone->lru_lock by allowing reclamation per NUMA node rather than globally. zone_reclaim_mode values of 1, 3 and 7 were attempted.
- Controlling the number of dirty pages requiring writeback before they reached levels observed during the spinlocks. The dirty page writeback frequency and watermark levels were modified to trigger writeback both earlier and more aggressively with vm.dirty_background_ratio, vm.dirty_ratio, vm.dirty_writeback_centisecs and vm.dirty_expire_centisecs.
- Expanding the emergency memory pool with vm.min_free_kbytes.
- Disabling transparent huge pages, as many sources such as Oracle, LWN and Varnish suggest they are detrimental for workloads similar to our caching server.
- Downgrading to RHEL 6.4, as changes allowing parallel zone_reclaim threads were introduced in 6.5+ kernels, which may have exacerbated the contention.
- Upgrading to RHEL 7 to test if there were any beneficial memory management improvements.
These tuning cycles provided minor improvements in performance, but did not prevent the spinlocks.
Conclusion
Two main problems caused us to move away from Varnish cache:
- General poor performance due to Varnish's usage of memory mapped files and the large size difference between RAM and backing store.
- Lock contention within the Linux kernel when evicting large amounts of pages, exacerbated by the use of memory mapped files.
The poor performance of memory mapped files limited data output to no more than 4 Gbps from a caching server. Combined with the unacceptable spinlocks these two problems were highly influential in us looking for a Varnish alternative. We tried hard to tune both Varnish and the OS, but never reached an acceptable level of performance.
Aside from the performance concerns, another undesirable side effect of Varnish using unlinked memory mapped files is that when the Varnish master process dies the full 8.6 TiB cache is lost. The Varnish master process can die because of a programming/system error or just because the service is restarted.
It is important to note that Varnish is successfully used in other BBC platforms. It performs well when the size of the cached content does not exceed RAM, for example on our web server farm. It is only on this very specific platform that Varnish doesn't meet our performance requirements.
The solution - replace Varnish with nginx
Varnish has been replaced with nginx, which increased caching server performance significantly. The following are key nginx features/configurations that allowed this:
- Using the ngx_http_proxy_module to provide the caching alternative to Varnish.
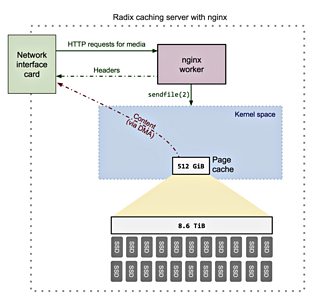
- Configuring nginx to use the sendfile(2) syscall. This syscall saves many CPU cycles and reduces PTE churn as data does not need to be copied to a user space buffer and back again, as would have been the case with Varnish. sendfile(2) also allows the kernel to use zero-copy features such as direct memory access (DMA) to transfer data directly from the page cache to the network interface card buffer - saving more CPU cycles.
Using nginx with the above configuration does not suffer the same performance problems as Varnish because content is not cached in memory mapped files. nginx also takes advantage of sendfile(2) to bypass user space when serving content, improving performance significantly. As a drop-in replacement, nginx allows a caching server to achieve 20 Gbps throughput compared to 4 Gbps using Varnish.
Further nginx improvements
The RAID 50 array appears to be the current bottleneck. We will remove the RAID 50 array and use the disks individually in a just a bunch of disks (JBOD) configuration, as a faulty disk no longer causes a full caching server failure as it previously would with Varnish. As disk I/O should improve with a JBOD configuration we may need to investigate whether adding nginx thread pools will further improve performance.
Credits
Thanks to Mindaugas Rasiukevicius rmind@noxt.eu for his significant contribution to the performance optimisation we have been undertaking and for thoroughly reviewing this blog post.
We are hiring!
Radix is just one of the projects we are working on in the BBC Digital Media Distribution team. If you like the idea of digging deep into an application and want to play an important part in the future of online media distribution, you can apply here.