
Logs produced by the Salesforce core application running in our production data centers are used for several internal use cases, for example: Product Intelligence evaluates product and feature adoption, Security does threat detection and forensics, and Software Engineers do live site investigations. Given the wide spectrum of use cases it is paramount that all the logs are transported to their destination (in what we call the “Secure Zone”) with high fidelity (i.e. a high degree of data completeness).
For several years, logs were shipped from all data centers into the Secure Zone via a legacy pipeline that comprised a homegrown log shipping agent (that collects logs from log files), LFTP as the transport method, and a SAN for long term storage. Over time, the legacy log shipping pipeline became increasingly fragile — snowflakes, system resiliency, and monitoring (or lack thereof) put the longevity and usability of the pipeline at risk — especially in light of 100% CAGR for log volumes. In late 2015 the Salesforce Infrastructure group embarked on a mission to build the next generation log shipping pipeline using cutting edge distributed systems technologies including Kafka and Hadoop/HDFS, code named Ajna and DeepSea respectively. This article is an articulation of our transformational journey to tune the next gen pipeline (called the Ajna/DeepSea pipeline) to transport logs at scale assuring high fidelity.
System Architecture and Scale
The picture below depicts the canonical architecture of the end-to-end log shipping pipeline.
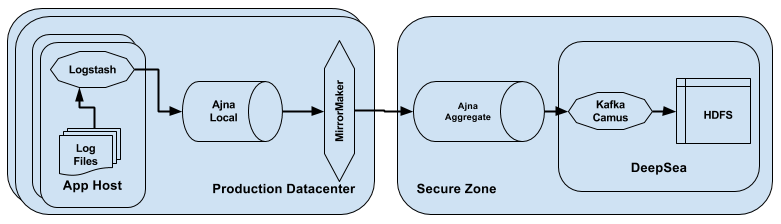
- Log File: The file on the filesystem to which logs are written by the Salesforce application. This is the start of the pipeline and used as a reference point for the measurement of completeness.
- Logstash: Logstash is an open source server side data processor that runs on every host (where Salesforce is running), reads logs from the Log Files and publishes them to the transport pipeline.
- Ajna Local: Ajna Local is an Apache Kafka cluster co-located in a every datacenter onto which the logs are published by Logstash on a specific set of topics. This cluster holds the logs temporarily before they are shipped to an aggregate location.
- Ajna Aggregate: Ajna Aggregate is an Apache Kafka cluster in the Secure Zone where data gets aggregated centrally which is then eventually consumed by several downstream processes. The central aggregate cluster comprises hundreds of brokers.
- Mirror Maker: MirrorMaker is an Apache tool that replicates data published on Ajna Local to Ajna Aggregate. This is co-located with Ajna Local and logs are pushed to Ajna Aggregate over WAN.
- Kafka Camus: Kafka Camus is an open source MapReduce job which consumes the logs from the Ajna Aggregate cluster and serializes them to HDFS.
- DeepSea: A large scale distributed Apache Hadoop ecosystem for long term storage. Logs are stored on HDFS before they are post processed for customers. This is the end of the log shipping pipeline.
Since our daily log volume doubled from 2015 to 2017 we definitely need this new architecture to scale but it also needs to be near complete. Despite being the largest known Kafka cluster, we were confident it could scale but we needed to make sure nearly all data would make it to the final data store. In our journey to roll out the new pipeline we learned some lessons for achieving that.
We started with a goal to achieve 99.999% (5 nines) completeness for logs shipped over the Ajna/DeepSea pipeline. Completeness is defined as the ratio of ‘log records landing in DeepSea’ to ‘all log records produced by Salesforce apps’ on any particular day. We also set an initial latency goal of 5 days to ensure that logs landed in DeepSea no more than 5 days delay.
The plan was set and we were ready to roll.
Path to High Fidelity
After a year of development by several teams, in Dec 2016 the end-to-end pipeline was rolled out to production. We developed a test harness to measure end-to-end completeness using a data sampling methodology. Each day a couple of hosts were selected at random for measuring completeness. This was ~1% of the entire fleet of hosts generating logs. It was the time to put the new pipeline’s fidelity to test while still running the old pipeline for production uses.
Dec 2016, Completeness → ~25.0% (sampling based)
Shocking, to say the least. We did not expect to hit a first pitch home run but we didn’t expect this either.
Investigation on the samples revealed that the loss of data was primarily contributed by the Kafka Camus jobs consuming logs from the Ajna Aggregate cluster. The jobs were dropping massive amounts of data on the floor and logs were not landing in DeepSea. Digging deeper surfaced some basic flaws in our distributed systems design.
- Scalability — Consumers were not designed to scale and one thread per partition was just not able to keep up with the traffic. Lag was unmanageable, eventually data dropping on the floor. We introduced parallelism by configuring multiple threads per partition adjusting dynamically to the volume of logs making the system elastic.
- Fault Tolerance — A single MapReduce job was responsible for consuming all data from all partitions — a recipe for failure. A single issue would block ingestion for the entire pipeline. This was addressed by adjusting the fault tolerance settings to tolerate 50% map failures thus improving the probability of sustained ingestion.
Needless to say, that our meticulous journey to tune the system in order to reach our goals had just begun.
Mar 2017, Completeness → ~90.0–99.0% (sampling based)
A huge leap into the 90% range! It was a relief to see the Kafka Camus jobs scaling and stabilization efforts paying off. This was in the ballpark of the expectations, we just needed to tune the system further.
Sampling gave us directionality. However, on any given day, completeness would vary in a range of 10%, making the results nondeterministic day to day. But on a brighter note, regardless of the samples and the variance in data, Camus improvements were holding up pretty well — all logs landing in Ajna Aggregate were consumed consistently each and every day into DeepSea.
The focus now shifted to the rest of the pipeline components for tuning. In order to do that we made two key decisions, the impact of which would be huge through the rest of the journey.
- Measure the entire fleet — Our goal was to measure end-to-end completeness for every single log record, no exceptions. Doing so would leave nothing to speculation. Results would be deterministic and would reveal infrastructure level idiosyncrasies that couldn’t be caught by sampling.
- ‘At Least Once’ semantics — Configure MirrorMakers in “ack = all” mode. This assured that MirrorMaker producers would guarantee mirroring of messages to Ajna Aggregate (albeit with possible duplicates) honoring the ‘at least once’ semantics of the pipeline.
May 2017, Completeness → ~98.0–99.0% (entire fleet)
Tremendous! The numbers were very promising and this was our first insight into log completeness for the entire fleet. This visibility helped established a baseline and improvements could be assessed in a deterministic way.
Kafka Camus consumers continued to hold up strong (over two months now), operating at scale as expected. We focused our attention to other parts of the pipeline to explore improvement areas. Our next stop was Logstash and our assessment revealed a couple of issues.
- Logs left behind — Logstash functionality was intertwined with the legacy pipeline since both accessed the same log files at the source. The legacy pipeline controlled the cadence of log file rotation. Sometimes, a deadly cocktail of amount of logs in the file, timing of file rotation, and Logstash seek latency on the file would result in Logstash skipping content in the file with logs being left behind. The issue manifested at random. Changing the Logstash file access pattern to ‘always read from the beginning’ addressed the issue (note, the default to tail the file).
- Logstash in zombie state — Logstash sometimes would get into a state where it pretended to ship logs, but in reality it wouldn’t. This typically occurred during shutdowns where the threads would attempt to flush the buffer before shutting down gracefully but instead would continue to spin indefinitely, causing the agent to hang. This bug required a hard kill workaround. Since, hard kill would destroy the buffer we devised a novel way to replay the buffer assuring no data loss.
While ‘at least once’ provided a safeguard around message guarantees it caused duplicates. Since duplicates and losses could potentially offset each other, we needed a means to dedupe the messages for better computational accuracy — a strategy that would work for an idempotent pipeline. For this we embedded a unique marker (hashed 4 byte id) directly on the log record itself — combining that with the name of the host and log record timestamp guaranteed uniqueness that could be tracked through the pipeline end-to-end.
Jul 2017, Completeness → ~99.999% (entire fleet)
We had prevailed and were ecstatic to finally reach our goal of 5 nines of completeness.
The Logstash related fixes were paying dividends. After monitoring completeness rates for two weeks, we greenlit our customers to consume logs from the pipeline. The Product Intelligence team compared scorecards with data from the legacy and new pipeline and gave us an initial thumbs. July data was deemed certified that it met the business needs and we had validation from our customer. Our confidence was through the roof.
Meeting the goal was over, now the challenge was to sustain it. In spite of the major rectifications to the pipeline, there were occasional bad days — data completeness for the entire fleet would drop to 4 nines and on rare occasions to even 3 nines with tens of millions of log records lost. Our monitoring helped detect the offending hosts easily for further diagnosis. While the pipeline was maturing, we introduced an operational means to sustain 5 nines of completeness. We devised a log replay methodology — a manually operated on-demand method to reship logs from the offending hosts using Logstash. Post replay, the originally lost logs would land in DeepSea and eventually completeness would reach 5 nines, albeit with delay, but within the 5 days. The pipeline was now functionally and operationally ready for business and we officially offered a business SLO to our customers — Logs will be available in DeepSea with 5 nines of completeness within 5 days.
Party time, right? Well, not quite, we had to wait a tad bit longer because of what happened next.
Aug 2017, Completeness → ~99.9–99.99% (entire fleet)
Yikes! Not even a month and the completeness had dropped.
We had a parallel initiative to expand the capacity of Ajna an order of magnitude by migrating to larger physically separate clusters. We took the opportunity to make an additional change which was to migrate the log traffic to more granular level topics. Granular topics helped with data isolation and better parallelism for downstream consumers. Post rollout, some topics showed increased data loss by one or two orders of magnitude. We had the log replay to our rescue, but since the impact was spread across 100s of hosts, the operational cost of supporting the replays was pretty high and not sustainable on a daily basis. We had to find a fix and we found it in how batching works in message transport in Kafka.
Messages flow over the pipeline in batches and we had configured the entire pipeline with a max batch size setting of 1MB (batches larger than this would be rejected by Kafka). However, we found some inconsistencies.
- MirrorMaker Batch Size — This was configured on the Aggregate cluster with a value too close to 1MB. A slight mismatch would result in batch rejects. Batch size was reduced to 250KB which was sufficient headroom and virtually eliminated the batch rejects.
- Logstash Batch Size — Logstash was using an older Kafka client and used manual batching via message counts which made it difficult to predict the size of the batches that could be published to Kafka. This was addressed by upgrading to a newer client with dynamic batching.
But why were rejects more prominent with granular topics? With coarse grained topics, large messages from one group of machines would randomly mix with smaller messages from other groups resulting in better and uniform batches. This advantage was lost with finer grain level topics. Groups producing large messages were impacted severely and the latent issues with batch size limits were exposed.
In the future, we plan to upgrade to an even newer Kafka to reduce the rejection rates by doing batch size splitting.
Sep 2017, Completeness → ~99.99999% (entire fleet)
Results were astonishing to say the least. We had not only hit a homerun but actually hit the ball out of the park. We started clocking 7 nines of completeness (two orders of magnitude higher than our goal) and we hit this mark consistently each day. To put things in perspective, 7 nines of completeness is 1 log record lost in 10 million records. By early Oct, we reached the 100 day milestone of sustaining 5 nines of completeness.
To top all of this, all customers of the log pipeline had signed off. This was icing on the cake.

So, can we achieve 8 nines, 9 nines or even 100% completeness?
The answer is simple — yes, it’s possible. However, the challenges are not related to lossiness of the pipeline, it has more to do with computational accuracy and the business need.
- Misconfigured logs — Log lines are not always formatted accurately in the files. Due to serialization issues there are instances of missing carriage returns affecting counting accuracy resulting in mismatches between what the scripts count as source of truth and what actually gets shipped over the pipe.
- Superlogs — These are logs that are massive in size and exceed 1MB. Due to the batch size on Ajna, they are rejected during shipping. On any given day we see about 5K-7K such logs across the entire fleet.
- ROI — Every order of magnitude of completeness improvement requires substantially large engineering effort. That effort is justified only if there is a business need.
Computation Methodology
We put the power of basic mathematical functions to full use — subtraction and division, and built a fidelity assessment service. The insights helped detect and diagnose issues early which resulted in making improvements to the services and maturing it over the last several months to achieve the completeness goals.
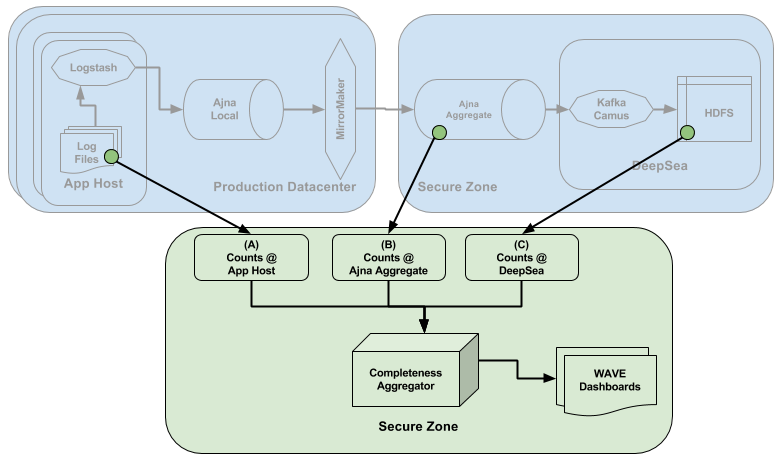
The fidelity assessment service comprised the following.
- Counts @ AppHost (A): This is a measure of number for log records in the log files produced on the hosts across the entire fleet. This is the source of truth against which the fidelity is measured. We built this with a Python script.
- Counts @ Ajna Aggregate (B): This is a measure of all the log records that landed in Ajna Aggregate cluster in the Secure Zone. Comparing this with (A) would indicate any data loss in the upstream part of the pipeline — Ajna, MirrorMaker or Logstash. We built this with a homegrown Kafka consumer.
- Counts @ DeepSea ©: This is a measure of log records landing in DeepSea HDFS. Comparing this with (A) would indicate any end to end loss in log shipping. Comparing this with (B) would indicate any data loss in the downstream part of the pipeline — Kafka Camus. We built a MapReduce job for this.
- Completeness Aggregator: This is the heart of the service that takes the raw counts A, B and C as input and produces early data loss signals and multi-dimensional insights.
Data completeness stats are refreshed every day in our Salesforce Einstein Analytics platform on a dashboard called Early Signals. It surfaced various areas impacting completeness that are useful to service owners for remediation. Key signals include the following:
- Amount of logs lost from hosts on a given day
- If logs were lost, provide a suggested list of hosts that are ideal replay candidates to meet the completeness goals
- Relative completeness comparison between Ajna Aggregate and DeepSea to narrow down problem areas
- Time elapsed completeness snapshots to track how completeness is reached over time in an event of high shipping latency and replay scenarios
For data transparency with our data customers, we also launched a dashboard, called Insights @ DeepSea. This dashboard provides overall completeness and SLO attainment. Insights includes the following:
- Fleet level log completeness for any given day (with SLO met or missed)
- Server group level completeness splits (with SLO met or missed)
- Time taken to meet SLO on any given day (to demonstrate data lands much sooner than 5 days)
- Statistical information on daily log volumes landing in DeepSea
Conclusion
With five teams, nine months, and a lot of unwavering commitment and perseverance, we had scaled the mountain top, just in time to put the legacy pipeline in a decommission plan.
Some key takeaways and learnings from our journey:
- Distributed Systems are Complex — Distributed systems at scale are some of the hardest problems to solve, especially in systems that are ambiguous, complex, and involve a wide gamut of technologies. Upfront due diligence on architecture, solution viability, technology fit, and sound monitoring are secrets to success. Use metrics to drive decision making. There is no magic button, just trust the process and trust in each other.
- Technology Evolves Fast — Design choices become obsolete with time and may not work with increasing scale. This also applies to off-the-shelf OSS components and at times may require us to tailor them to our specific needs or innovate organically. For example, Camus is already being EOL’d so we must now evaluate alternatives.
- Metrics Driven Service Maturity — For data pipelines, fidelity measurement as a basic acceptance criteria is essential. We approached this need in a reactive manner in this project, instead of being proactive. This was one of our biggest learnings and could have potentially taken a shorter journey if we had measured the whole fleet from the beginning.
These learnings position us to tackle complex and ambiguous projects in the future with greater success. If these kinds of problems interest you, check out our job offerings!
Thanks to Wei Li, Gaurav Kumar, Chris Mueller, Kelly Shkuratoff, Aakash Pradeep and Sambit Samal for their notable contributions.