At GOV.UK Verify we recently encountered a technical performance issue: a memory leak problem with our application that is responsible for any end-user facing functionality. We’ve been running extensive performance testing as we prepare for going live next April and discovered that if our performance benchmark tests were run as usual (nightly) and the application (we call it “frontend”) was not restarted for over 48 hours it would crash. Even though this issue wasn’t yet affecting the public we were keen to fix it before it got any further.
The opportunity to really get to the bottom of a memory problem is quite a rarity in the life of a developer and this showed in the fact that our investigations (alongside other work) lasted over a month. This post briefly documents the things we tried to fix the issue, and of course, the cause of the problem which led to its resolution.
Our frontend application is a RESTful service built using the Dropwizard framework using Java. It is a single jar file containing code and assets such as javascript, css files and images.
Heap
The first thing we did was to make sure we had set the
-XX:+HeapDumpOnOutOfMemoryError
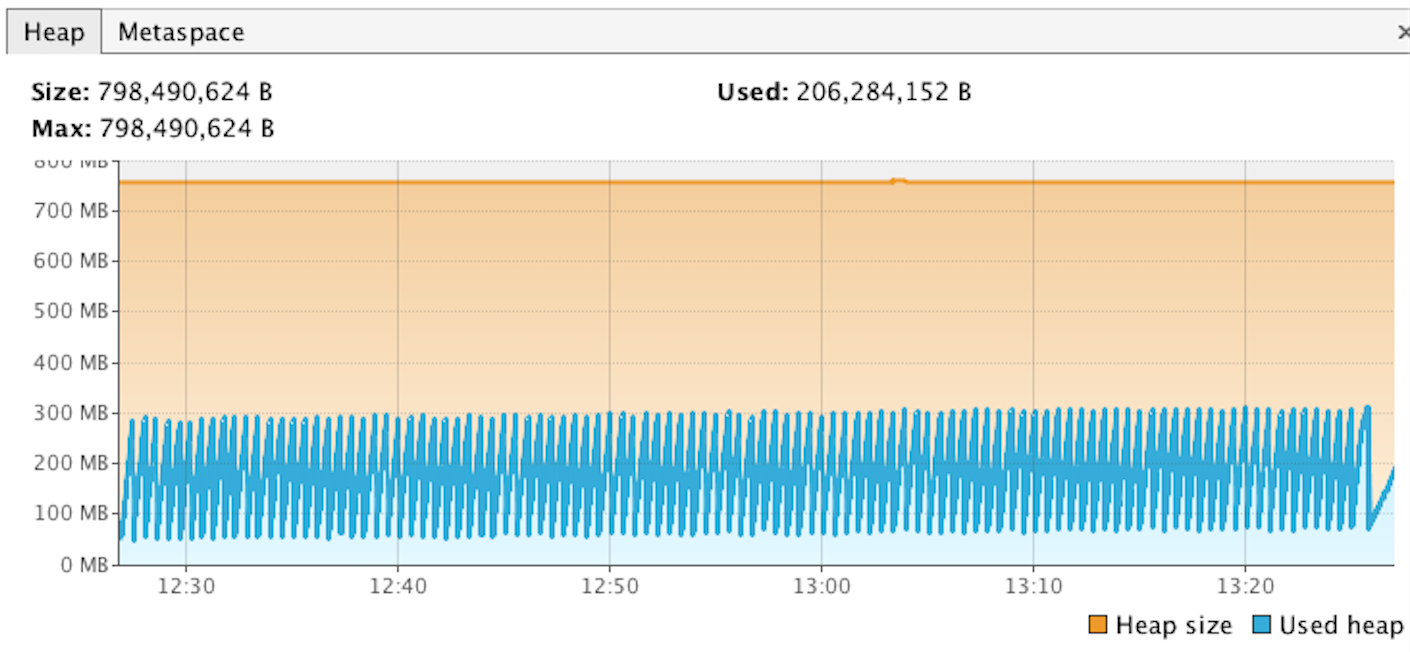
JVM (java virtual machine) parameter in order to get a heap dump at the point the application crashes which would allow us to see what was happening in the application at the time it crashed. After a few runs of the tests the app exited but we didn’t get the heap dump (.hprof) file we were expecting. A log file, hs_err_pid<pid>.log was produced by the JVM but this only told us a fatal error had been detected, the memory history and a bunch of other jvm information. This seemed strange so we attached Visual VM to a live performance test run and monitored the heap usage that way. By monitoring the heap usage this way we were able to see that the heap usage was barely growing at all over the duration of the test run, and explains why we weren’t getting a heap dump. The leak must be outside of the heap.
Outside The Heap
It would’ve been great if heap space was the problem. Memory leaks in heap space and their solutions are generally well documented. Unfortunately this was not the case. Fortunately we use Metrics and collectd to push JVM and native memory usage into Graphite:
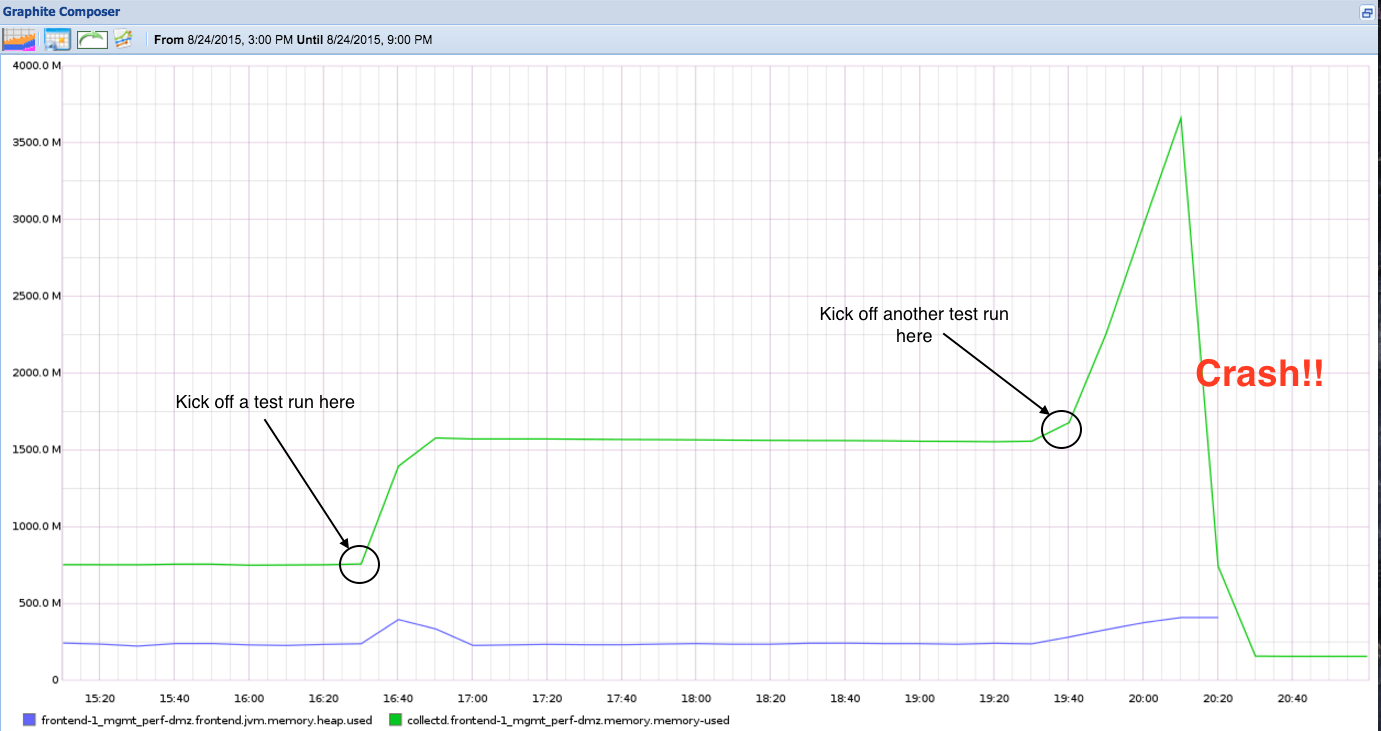
The graph above shows that:
- It typically takes about two performance tests runs to crash the application
- Java memory growth is outside the heap and can go as large as 3.5G before it causes an Out-Of-Memory and gets killed by the Linux kernel.
- Java heap is not the problem.
The fact that the leak was outside of the heap leaves us with two possible causes:
- Metaspace
- Native memory
After a bit of digging around in git and graphite we noticed that around the time we first encountered the issue we had upgraded to using Java 8. One of the changes introduced by the new version was the removal of the old PermGen memory space and the introduction of Metaspace. Metaspace (like its predecessor PermGen) sits outside the heap. Could we have introduced a leak in Metaspace?
Again here Visual VM allowed us to confirm this was not the case. Despite us not setting the max Meta Space size it didn’t grow significantly over time.
Playing the guessing game
The problem with native memory leaks is that the Java Virtual Machine (JVM) has no idea about free memory in the underlying operating system and doesn’t care about it. This led us to try a few solutions which led us nowhere.
Did anything change in the code?
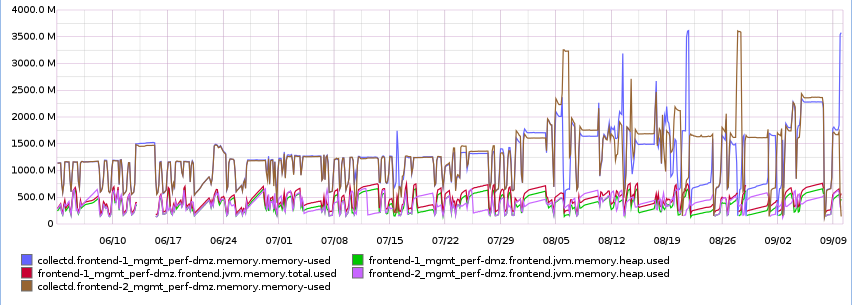
Looking back over time in graphite we could see increased memory usage in our app which started around the 5th of August. Looking at commits around this time the prime suspect was the introduction of a third party library which depended on netty which could be a candidate for excessive memory consumption; however removing the library didn’t solve the problem.
Was it the upgrade from Java 1.7 to 1.8?
We changed the Java version from 1.7 to 1.8 on our boxes before this started happening. Reverting back to Java 1.7 didn’t solve the problem.
Is there any setting that could restrict the amount of virtual (native) memory the java process uses?
We attempted to restrict the memory pool used by the JVM as documented here but this didn’t work for us as our version of Ubuntu didn’t have the version of glibc (more on this later) that had this feature.
So what can can cause a leak in native memory?
The most likely suspect is Java Native Interface (JNI). We hadn’t explicitly made any JNI calls in our application but perhaps one of our dependencies was. But how would we find out which?
JEMALLOC to the rescue
After some searching we came across this blog post which suggested using jemalloc to record the underlying memory allocation while our app was running and using it to generate a graph showing memory allocation per process.
What is jemalloc?
The default Linux native memory allocator is glibc’s malloc. The JVM (like any other process) will call the C runtime malloc function in order to allocate memory from the operating system and then manages the heap for the Java application. Jemalloc is another malloc implementation, and has a great tool called jeprof which does memory allocation profiling which allows us to visually trace what is calling malloc.
Ok, so what now?
After installing jemalloc we forced our jvm to use it (instead of glibc’s malloc) by easily setting the environment variable:
export LD_PRELOAD=/usr/local/lib/libjemalloc.so
We also tell jemalloc to write a profile to the disk every few 1Gb allocations and record a stack trace (referenced from the blog):
export MALLOC_CONF=prof:true,lg_prof_interval:30,lg_prof_sample:17
We then started our app with the usual jvm -jar frontend.jar … and kicked off our tests. Jemalloc should now be writing profile snapshots called jeprof*.heap. After checking the leak is occurring we generated a memory report using reproof:
jeprof --show_bytes --gif /path/to/jvm/bin/java jeprof*.heap > /tmp/app-profiling.gif
Which showed us something like:

Here we could see that what was consuming about 43.4% of total process size - 1.02G - was coming from java.util.zip.Inflater.inflateBytes -> inflate -> updatewindow. From the javadoc, we know the Inflater class provides support for general purpose decompression using the popular ZLIB compression library.
Rerunning the tests and taking thread dumps we were able to see what was calling java.util.zip.Inflater.inflateBytes:
dw-116 - GET /assets/stylesheets/style-print.css" #116 prio=5 os_prio=0 tid=0x00007f703803c800 nid=0x4f47 runnable [0x00007f70372ef000] java.lang.Thread.State: RUNNABLE at java.util.zip.Inflater.inflateBytes(Native Method) at java.util.zip.Inflater.inflate(Inflater.java:259) - locked <0x00000000f6e20a30> (a java.util.zip.ZStreamRef) at java.util.zip.InflaterInputStream.read(InflaterInputStream.java:152) at java.io.FilterInputStream.read(FilterInputStream.java:133) at java.io.FilterInputStream.read(FilterInputStream.java:107) at com.google.common.io.ByteStreams.copy(ByteStreams.java:70) at com.google.common.io.ByteStreams.toByteArray(ByteStreams.java:115) at com.google.common.io.ByteSource.read(ByteSource.java:258) at com.google.common.io.Resources.toByteArray(Resources.java:99) at io.dropwizard.servlets.assets.AssetServlet.loadAsset(AssetServlet.java:217) at io.dropwizard.servlets.assets.AssetServlet.doGet(AssetServlet.java:106) at javax.servlet.http.HttpServlet.service(HttpServlet.java:687) at javax.servlet.http.HttpServlet.service(HttpServlet.java:790)
So the cause is the calls to AssetServlet, which according to the Dropwizard javadoc is the class that serves static assets such as images, css files etc from a location which happens to be inside our frontend jar file.
Armed with this knowledge we tried the following options which stopped the decompression of assets and effectively stopped the memory leak:
- Using an uncompressed jar (jars are effectively zip files and are compressed by default).
- Serve assets from the nginx instance sitting in front of the frontend server.
This is what no memory leak looks like:
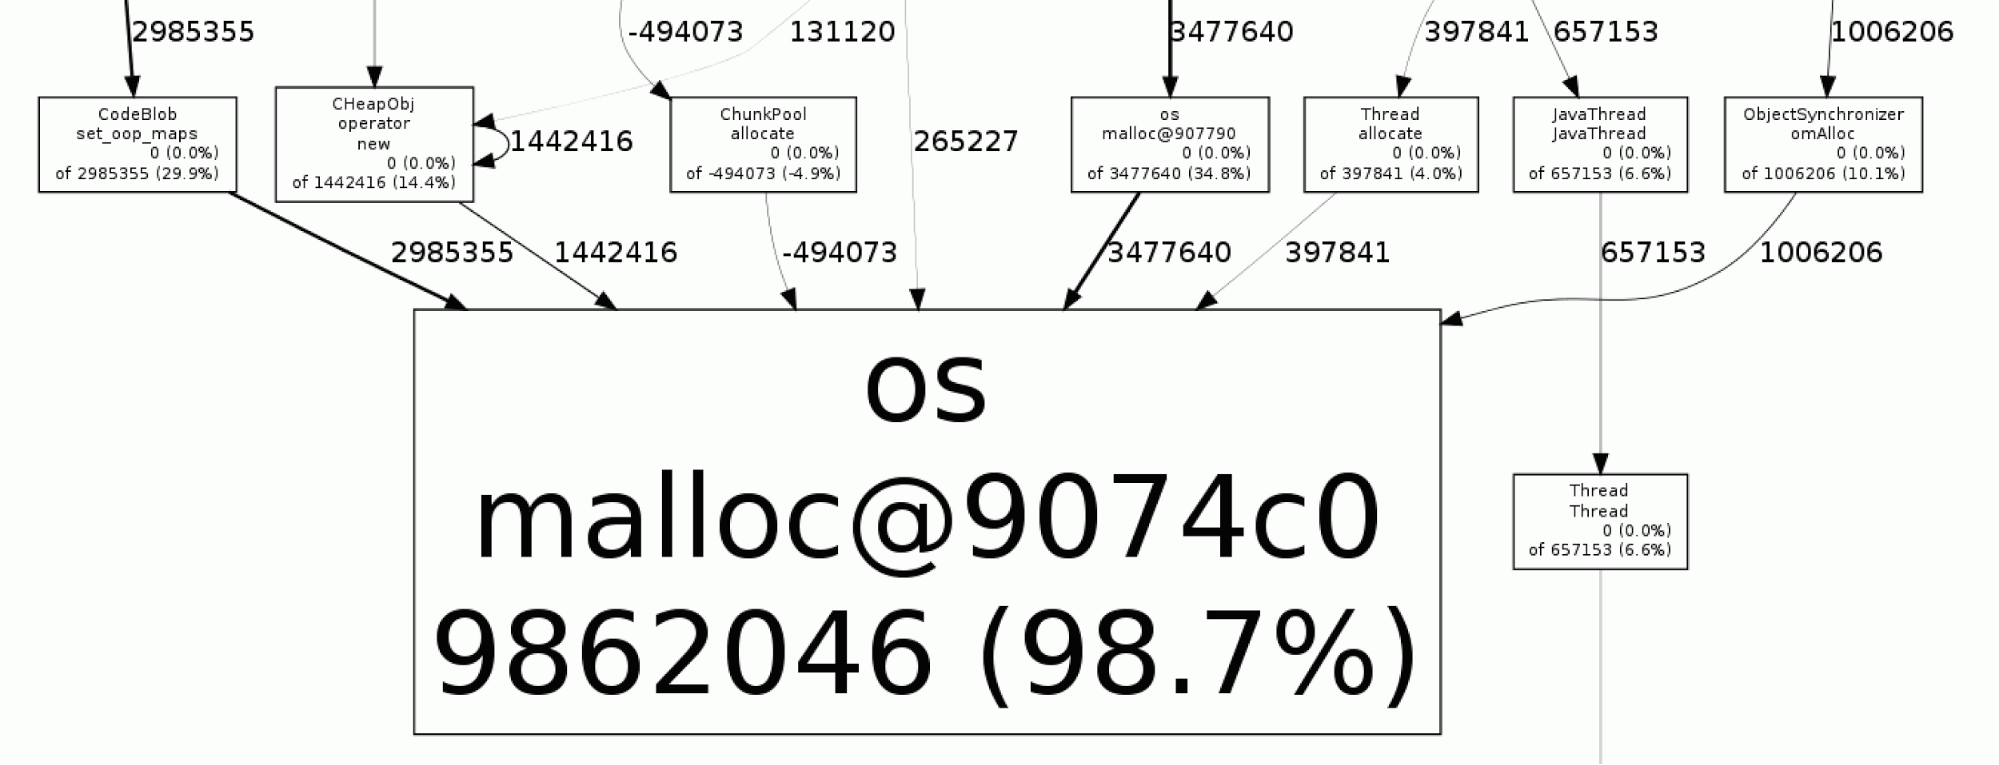
Nearly all (98.7%) of the malloc calls come from os:malloc and therefore the JVM itself.
Conclusion
This experience underscored the importance of having a range of monitoring and diagnostic tools. Every application should be logging metrics; a visualizer like graphite is necessary to view and compare sets of historical data; and Visual VM is a great tool for connecting to a [remote] live application and seeing JVM stats in real time.
Finding causes of native memory leaks has long been a tricky process but we discovered that jemalloc is a great tool for analyzing these issues. Now that we have it in our toolkit, we expect to be able to resolve this kind of issue far faster should they occur in the future.
If this sounds like a good place to work, take a look at Working for GDS - we're usually in search of talented people to come and join the team.

6 comments
Comment by Evan Jones posted on
Thanks for referencing my blog post! Its also amazing that it is effectively the same underlying cause: not closing a ZipInputStream!
However: I don't think you found the *real* root cause. Looking at the stack trace you provided: Google Guava ensures it always closes the ZipInputStream, even if there is an error or exception. My theory: there is some other code that is reading resources from your compressed JAR. That code forgot to close the InputStream somewhere and is the real cause of the leak. However that code doesn't run very often, so when you were running jstack periodically you didn't catch it.
Tracking down these bugs is pretty hard. If you want to find it, I'd start by searching your code (and any libraries) for calls to getResource or getResourceAsStream. I think FindBugs can also search for cases where InputStreams are not closed. It may also be possible to run in a debugger and set a breakpoint on something like ZipInputStream.read(), but I haven't had success with that.
If you do figure out the real root cause of the bug, let me know! I'd be very, very interested. Thanks!
Comment by oswald posted on
Hi Evan,
Thanks for your comment. Let us first say thank you for blog - it really helped us!
You are right - we didn't find the real root cause. We tried to duplicate the problem by creating a separate Dropwizard application that serves image(s) and using Apache benchmark to hit that application hard - with the intention of sending a reproducible bug to the folks at Dropwizard. Unfortunately we couldn't duplicate the problem which supports your idea that it could be some other part of the app which is responsible (and that our current solution is masking the real issue).
We've done a quick search across the codebase for getResourceAsStream and didn't find anything that looks immediately broken; however we're pretty busy working towards our go-live date (and it's holiday season now) so we currently don't have any plans to dig deeper into the problem. If we do in the future and do find the cause we will let you know!
Comment by Evan Jones posted on
You still managed to resolve the problem and get the software working, so great work! Finding the "final" cause at this point doesn't matter much, so I totally understand that it isn't worth the time. Cheers!
Comment by Jesper Skov posted on
Super posting. Thanks!
Comment by Anil Kapoor posted on
Great Post, Written exactly in the way I need 🙂
Comment by Wayne Wang posted on
Hi~ I've got across the same problem with yours. Uncompressed jar may resolve the problem? Let me have a try. Thanks for your post.