I love debugging tools. One of the most frustrating things to me is – when I run a Ruby or Python program, I can’t find out what that program is doing RIGHT NOW.
You might eagerly interrupt me – julia, you say, you can use pdb! or pry! or rbtrace!.
So, let me explain. If I’m running a program on the JVM with PID 4242, I can run jstack -p 4242, and it will print the current stack trace of the Java program. Any Java program. It doesn’t need any special configuration!!
In C, you can run sudo perf top on a Linux machine and it’ll instantly give you a live profile of all the C functions that are running. For any C program. (did you know you can do this?! this is one of my favorite things. it is amazing!). pstack does something similar to jstack, but only for 32-bit binaries :(.
In Ruby.. there’s nothing, yet. You can pre-instrument your Ruby program and there are libraries you can use, but this stuff isn’t built into the ecosystem in the same way. This makes me grumpy because I’m like IF JAVA CAN HAVE NICE THINGS THEN WHY NOT RUBY AND PYTHON??
So, let’s talk about how you could build jstack for Ruby.
step 1: gdb
Scott Francis from Shopify has this great gdb script that will print a Ruby stacktrace if you attach to it with gdb. You can read how the script works in Adventures in Production Rails Debugging.
It took me a couple of days to understand what’s going on with that script – when you attach to a program with gdb, it seems like basically black magic, but as usual it’s actually not magic at all.
First, let’s explore a little with gdb. This is a little messy, but I want you to see how you explore a program’s memory with gdb because I think it’s cool. I’ve redacted some of the longer output.
# HELLO RUBY. What is the address of the current thread in this process?
(gdb) p ruby_current_thread
$1 = (rb_thread_t *) 0x55b89eb775b0

# SWEET. let's get the current frame pointer! That is where
# we are going to find the stack trace!
(gdb) p ruby_current_thread->cfp
$2 = (rb_control_frame_t *) 0x7f217f1dbfc0

# Oh, but I didn't just want the address! Let's see what's inside!
(gdb) p *(ruby_current_thread->cfp)
$3 = {pc = 0x55b89ecd2ca0, sp = 0x7f217f0dc020, iseq = 0x55b89ecd2840,
    flag = 833, self = 94251425195000, klass = 8, ep = 0x55b89ecd2df8,    block_iseq = 0x0,
    proc = 0, me = 0x0}

# Next step: we need to look at the `iseq` property. That's another
# pointer, and we'll also dereference it to see what's inside
(gdb) p ruby_current_thread->cfp->iseq
$4 = (rb_iseq_t *) 0x55b89ecd2840
(gdb) p *(ruby_current_thread->cfp->iseq)
$5 = {type = ISEQ_TYPE_TOP, location = {path = 94251425516800, absolute_path =
8, base_label = 94251425523360, label = 94251425523360,      first_lineno = 1},
iseq = 0x55b89ecd2c80, iseq_encoded = 0x55b89ecd2ca0, iseq_size = 2, mark_ary =
[... left out a bunch of stuff here ...]}

# Phew. That was kind of long. Luckily, we just care about
# `location.path` and `location.label.`
# Let's print those out!
(gdb) p *((struct RString*) (ruby_current_thread->cfp + 1)->iseq.location.label)
$7 = {basic = {...}, as = {heap = ...,
    ary = "block in initialize\000\000\000\000"}}
(gdb) p *((struct RString*) (ruby_current_thread->cfp + 1)->iseq.location.path)
$8 = {basic = {flags = 546318437, klass = 94660819015280}, as = {heap = {len = 64,
ptr = 0x5617f3432440 "/home/bork/.rbenv/versions/2.1.6/lib/ruby/2.1.0/webrick/utils.rb",}
This is amazing. It’s amazing, because we started with practically nothing – just an address of the current thread! And we finished with a file (/home/bork/.rbenv/versions/2.1.6/lib/ruby/2.1.0/webrick/utils.rb), and a place we are in that file: block in initialize. We had to write a kind of weird thing to get that information (*((struct RString*) (ruby_current_thread->cfp + 1)->iseq.location.label)), but we got it.
The script from before basically does what I just did, except it’s a little smarter and can also get you line numbers. Cool.
gdb isn’t good enough
So this is pretty awesome. We can attach to almost any Ruby process and get a stack trace! Isn’t that what I wanted?
Well, not quite. gdb uses the ptrace system call, in this case to stop the program in its tracks and then intensely query it for its internals. This is slower than what I want. Maybe my Ruby program needed to actually keep running!
When I ran that gdb command p *((struct RString*) (ruby_current_thread->cfp + 1)->iseq.location.path) – it does a ton of stuff. I was going to paste the strace output of what gdb is actually doing, but it is 20 megabytes of system calls. So here’s a small excerpt: Every time I need to read memory from the target program (which is what looking up strings is doing!), it issues a bunch of system calls like
ptrace(PTRACE_PEEKTEXT, 5677, 0x5617f3432440, [0x6f622f656d6f682f]) = 0
ptrace(PTRACE_PEEKTEXT, 5677, 0x5617f3432448, [0x6e6562722e2f6b72]) = 0
ptrace(PTRACE_PEEKTEXT, 5677, 0x5617f3432450, [0x6f69737265762f76]) = 0
ptrace(PTRACE_PEEKTEXT, 5677, 0x5617f3432458, [0x362e312e322f736e]) = 0
ptrace(PTRACE_PEEKTEXT, 5677, 0x5617f3432460, [0x6275722f62696c2f]) = 0
ptrace(PTRACE_PEEKTEXT, 5677, 0x5617f3432468, [0x2f302e312e322f79]) = 0
ptrace(PTRACE_PEEKTEXT, 5677, 0x5617f3432470, [0x2f6b636972626577]) = 0
ptrace(PTRACE_PEEKTEXT, 5677, 0x5617f3432478, [0x62722e736c697475]) = 0
ptrace(PTRACE_PEEKTEXT, 5677, 0x5617f3432480, [0x780062722e736c00]) = 0
So, how does gdb work? Here’s what it does:
First, it reads debugging info out of my Ruby binary. This tells it the size and structure of the structs it needs access to – rb_iseq_t, struct RString, rb_control_frame_t. If you don’t know what the memory at address means, you can’t do anything!
So, let’s say I run p ruby_current_thread->cfp in gdb. What does gdb do, exactly?
- Look up the address of
ruby_current_threadin the symbol table. Let’s say that’s 0x5617f3432440. - Look in the debug info to figure out what type it has (
rb_thread_t) - Go get the bytes at address
0x5617f3432440, by using theptrace(PTRACE_PEEKTEXTsystem call - Look in the debug info to figure out what the offset is of the
cfpmember of therb_thread_tstruct.
we’re done! So, this is really cool. We’ve learned how gdb works! Pris Nasrat helped me figure out how gdb works.
DWARF
Before we move on, we need to talk about DWARF. Remember when I said it reads debugging info out of the Ruby binary? That uses a format called DWARF. I’m not going to go into how you read that info right now because frankly I don’t know.
But – when people say “you need to compile this with debugging symbols”, what they mean by “debugging symbols” is DWARF.
spying on our program without gdb.
Okay, cool! So, what if we wanted to get stack traces out of a program without gdb? Is that a thing that could happen? Turns out: yes!
When we were learning how gdb works, we figured out that as long as you have
- the debugging info, and
- the ability to read memory from your target program
you’re good to go! gdb happens to use the ptrace system call to read memory from the Ruby program, but that’s not necessary, it turns out! We are going to make a new friend.
process_vm_readv
Julian Squires was the person who made me think about all of this in the first place, and I emailed him like UGH JULIAN HOW DO I MAKE THIS WORK and he was like “process_vm_readv!“. So, what’s that? It’s a Linux system call! The man page says:
These  system calls transfer data between the address space of the
calling process ("the local process") and the process identified by pid
("the remote process").  The data moves directly between the address
spaces of the two processes,  without  passing  through kernel space.
So, if I want to spy on the memory of a Ruby program, for example because I’m writing a debugger, I can use process_vm_readv! Neat!
The reason this is awesome and better than what gdb does is – as far as I can tell, the impact of process_vm_readv on the running process is WAY SMALLER. You just spy on the memory and get out of the way!
actually building a thing
So far this is all just talk. Does this actually work, Julia? Is it real? Sort of! I wrote a program in Rust to sample stack traces. Rust was a cool way to do this because I don’t know how to manually manage memory in C or C++, so literally my C program to do this was just instant memory leaks. In Rust I just had to deal with the compiler, and then I ended up with a working program pretty quickly!
So, I wrote a prototype program to do this. You can see the source here.
it works, kind of
And it WORKED. It started spitting out stack traces of the Ruby program I was writing, every 10 milliseconds! It was pretty fast! It was amazing! I used it to generate a flame graph. here is my cool flame graph:
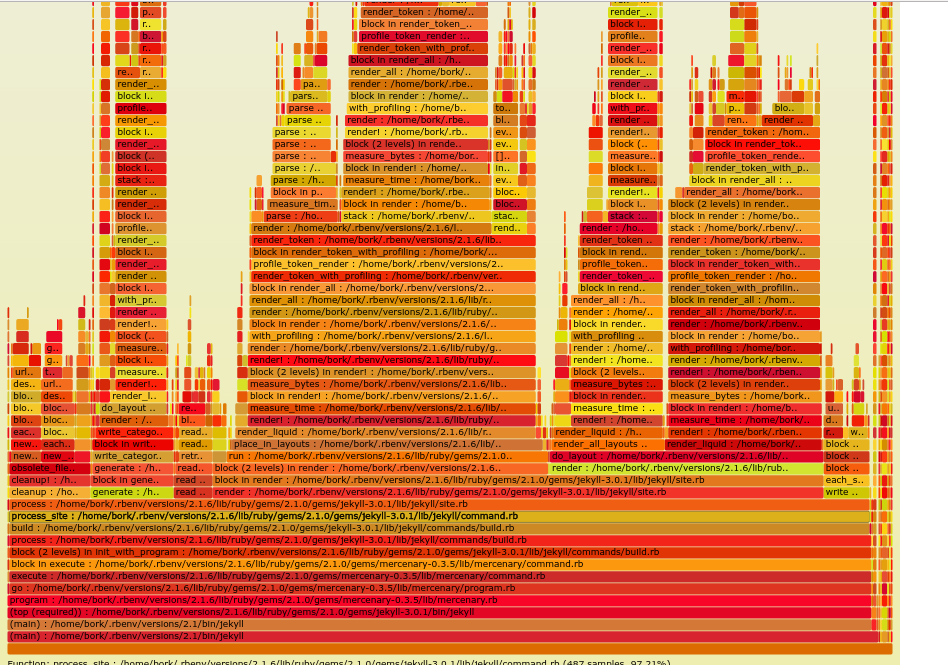
So, that was the good news. The bad news is that I didn’t actually learn to use the DWARF libraries yet, so I hardcoded all the struct types, and as a result it doesn’t work on anybody’s computer but my own. And then I have an actual programming job to do, which so far is in the way of progress. But instead of feeling bad that I haven’t actually gotten the software to work yet on other peoples’ computers, I thought I would take a couple of hours and tell you how it works! Maybe this will motivate me to actually fix it up and make it into Real Software some day later!
debuggers are exciting
this made me even more excited about writing debugging tools! Some questions I have
- does this tool, that can spit out Ruby stack traces quickly for any Ruby program with debugging symbols enabled, actually exist somewhere and I just don’t know about it?
- what about for Python?
- maybe it doesn’t exist because a Linux-only Ruby debugging tool is sort of a weird thing?
- if we can build this, and it doesn’t exist yet, what other amazing debugging technology could we build?
Thanks to Julian Squires, Pris Nasrat, and Kamal Marhubi for helping me with new system calls / gdb / writing Rust!